| __timestamp | United Rentals, Inc. | Verisk Analytics, Inc. |
|---|---|---|
| Wednesday, January 1, 2014 | 758000000 | 227306000 |
| Thursday, January 1, 2015 | 714000000 | 312690000 |
| Friday, January 1, 2016 | 719000000 | 301600000 |
| Sunday, January 1, 2017 | 903000000 | 322800000 |
| Monday, January 1, 2018 | 1038000000 | 378700000 |
| Tuesday, January 1, 2019 | 1092000000 | 603500000 |
| Wednesday, January 1, 2020 | 979000000 | 413900000 |
| Friday, January 1, 2021 | 1199000000 | 422700000 |
| Saturday, January 1, 2022 | 1400000000 | 381500000 |
| Sunday, January 1, 2023 | 1527000000 | 389300000 |
| Monday, January 1, 2024 | 1645000000 |
Unlocking the unknown
In the ever-evolving landscape of corporate finance, understanding operational costs is crucial. Over the past decade, United Rentals, Inc. and Verisk Analytics, Inc. have showcased distinct trends in their Selling, General, and Administrative (SG&A) expenses. United Rentals has seen a steady increase, with expenses rising from approximately $758 million in 2014 to a projected $1.645 billion in 2024. This represents a growth of over 117%, highlighting their expanding operational scale.
Conversely, Verisk Analytics has maintained a more stable SG&A trajectory, peaking at around $603 million in 2019 before stabilizing near $389 million in 2023. This stability suggests a consistent operational strategy, even amidst market fluctuations. Notably, data for 2024 is missing for Verisk, indicating potential changes or reporting delays.
These insights into SG&A expenses provide a window into each company's strategic priorities and operational efficiencies, offering valuable lessons for investors and industry analysts alike.
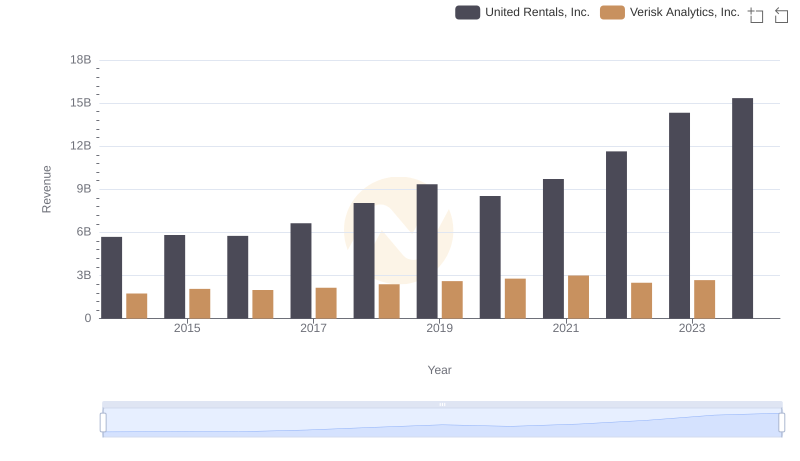
Revenue Insights: United Rentals, Inc. and Verisk Analytics, Inc. Performance Compared
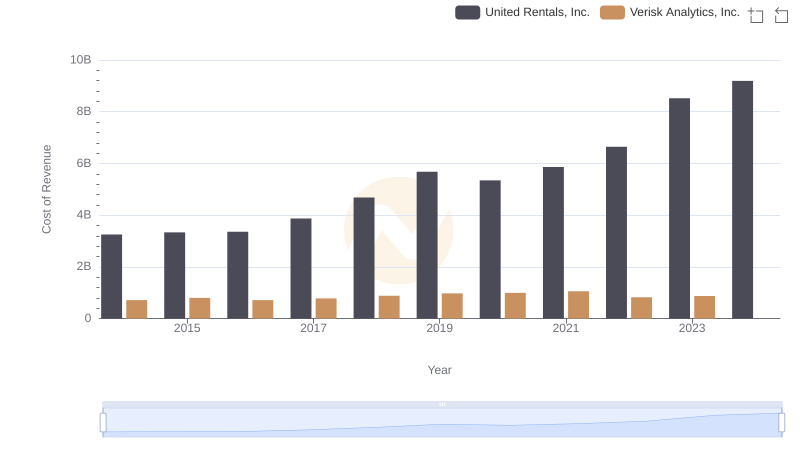
Cost of Revenue Comparison: United Rentals, Inc. vs Verisk Analytics, Inc.
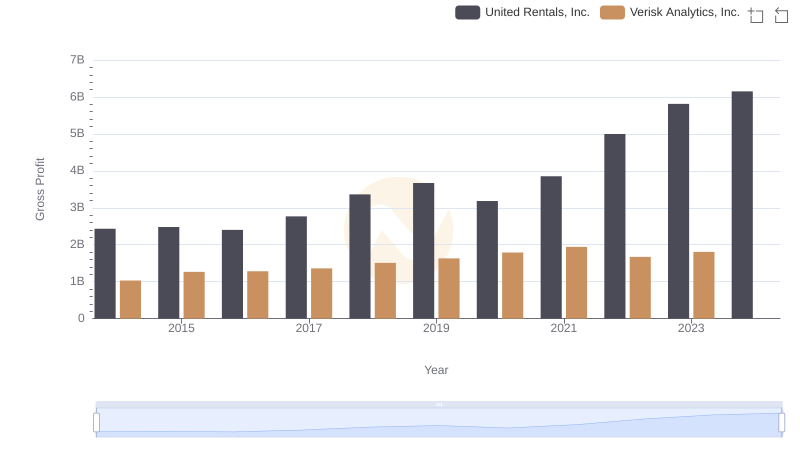
Gross Profit Trends Compared: United Rentals, Inc. vs Verisk Analytics, Inc.
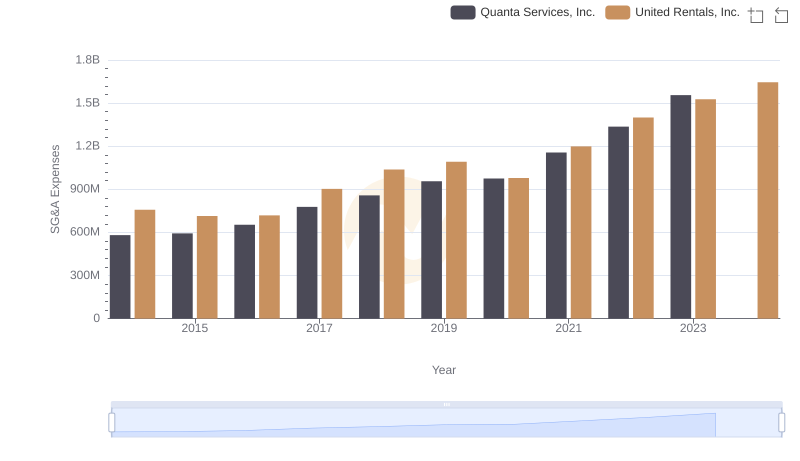
United Rentals, Inc. and Quanta Services, Inc.: SG&A Spending Patterns Compared
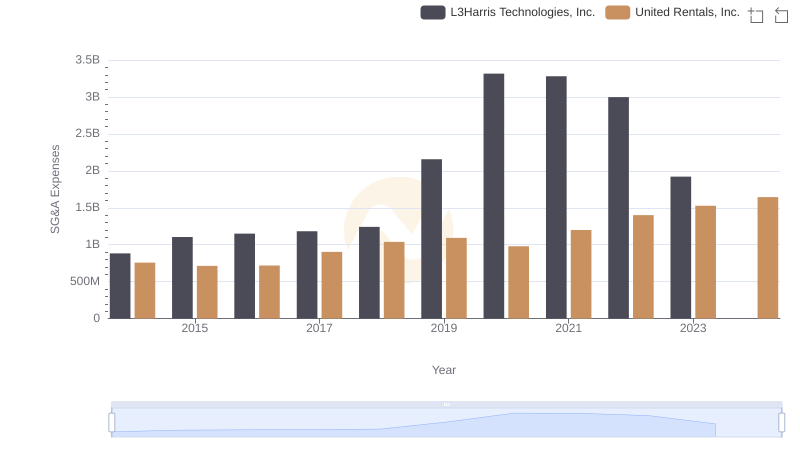
United Rentals, Inc. vs L3Harris Technologies, Inc.: SG&A Expense Trends
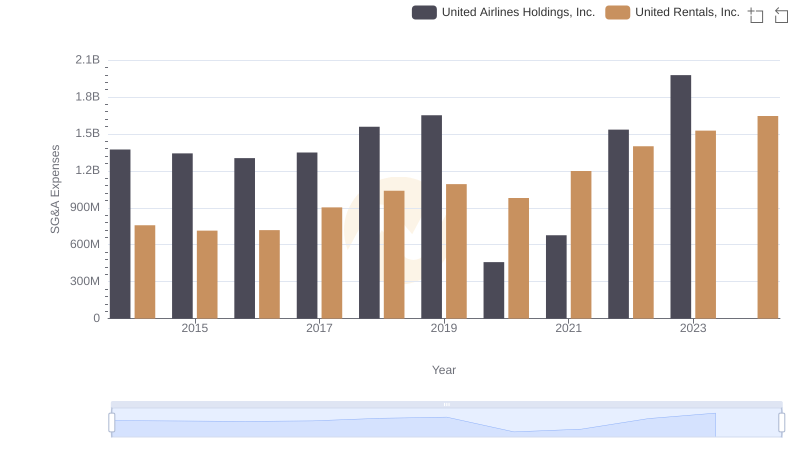
SG&A Efficiency Analysis: Comparing United Rentals, Inc. and United Airlines Holdings, Inc.
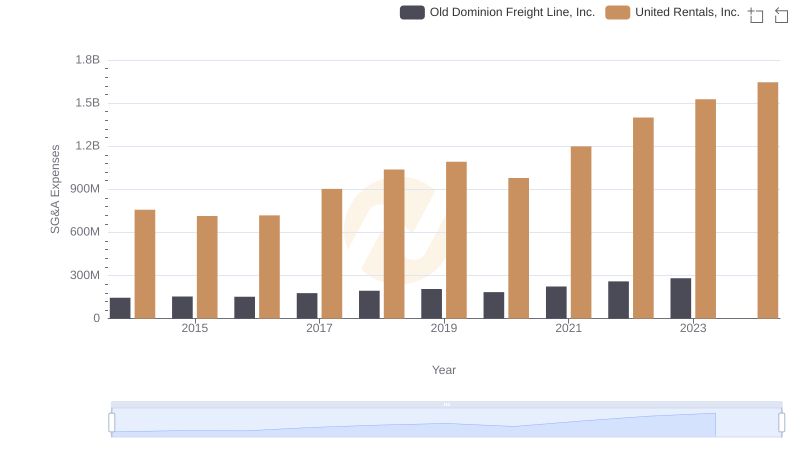
Cost Management Insights: SG&A Expenses for United Rentals, Inc. and Old Dominion Freight Line, Inc.
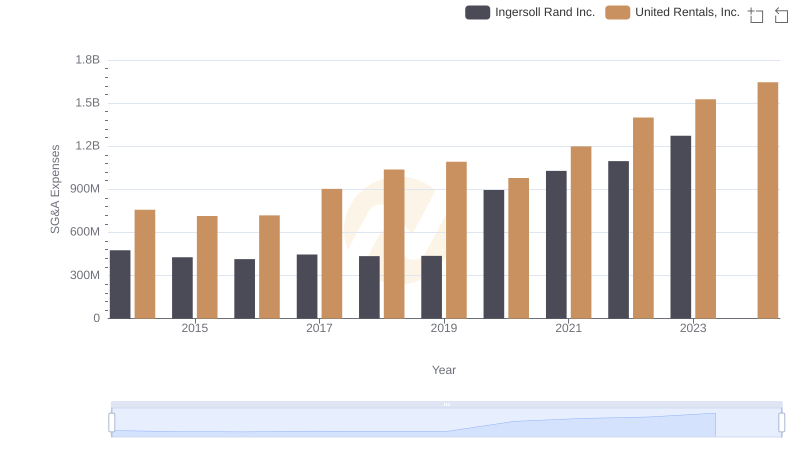
United Rentals, Inc. and Ingersoll Rand Inc.: SG&A Spending Patterns Compared
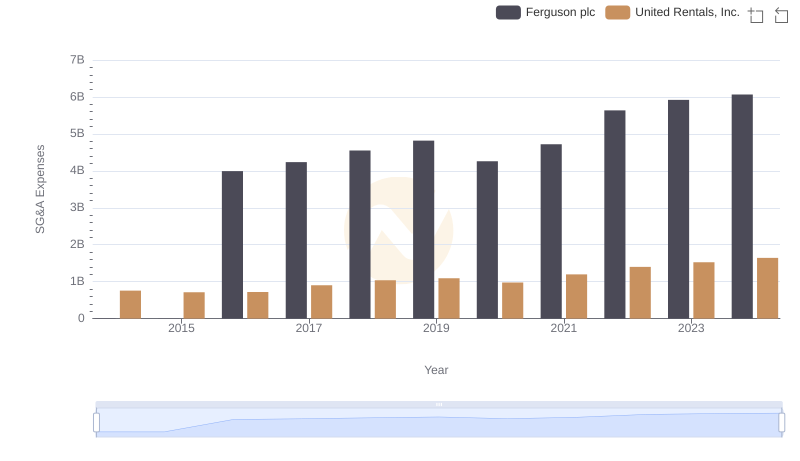
Comparing SG&A Expenses: United Rentals, Inc. vs Ferguson plc Trends and Insights
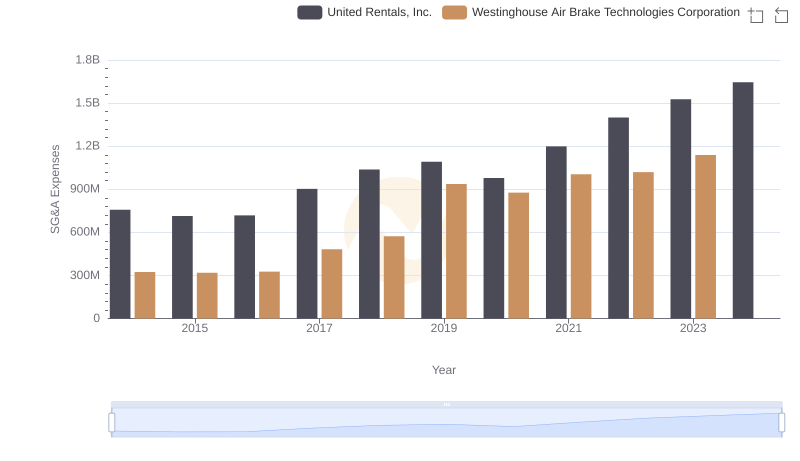
Cost Management Insights: SG&A Expenses for United Rentals, Inc. and Westinghouse Air Brake Technologies Corporation
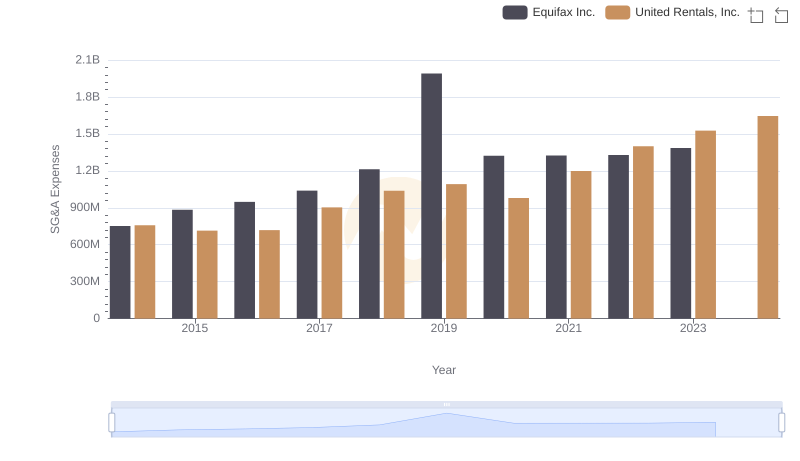
United Rentals, Inc. vs Equifax Inc.: SG&A Expense Trends
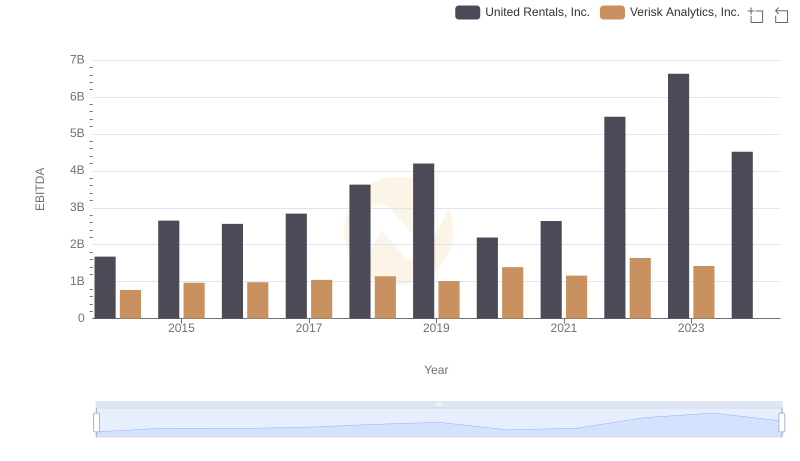
United Rentals, Inc. and Verisk Analytics, Inc.: A Detailed Examination of EBITDA Performance