| __timestamp | United Rentals, Inc. | Verisk Analytics, Inc. |
|---|---|---|
| Wednesday, January 1, 2014 | 2432000000 | 1030128000 |
| Thursday, January 1, 2015 | 2480000000 | 1264736000 |
| Friday, January 1, 2016 | 2403000000 | 1280800000 |
| Sunday, January 1, 2017 | 2769000000 | 1361400000 |
| Monday, January 1, 2018 | 3364000000 | 1508900000 |
| Tuesday, January 1, 2019 | 3670000000 | 1630300000 |
| Wednesday, January 1, 2020 | 3183000000 | 1790700000 |
| Friday, January 1, 2021 | 3853000000 | 1940800000 |
| Saturday, January 1, 2022 | 4996000000 | 1672400000 |
| Sunday, January 1, 2023 | 5813000000 | 1804900000 |
| Monday, January 1, 2024 | 6150000000 |
Unveiling the hidden dimensions of data
In the ever-evolving landscape of the U.S. stock market, understanding the financial health of companies is crucial. This analysis delves into the gross profit trends of two industry giants: United Rentals, Inc. and Verisk Analytics, Inc., from 2014 to 2023.
United Rentals has shown a remarkable upward trajectory, with gross profits soaring by approximately 153% over the decade. Starting at $2.43 billion in 2014, the company reached an impressive $6.15 billion by 2023. This growth reflects United Rentals' strategic expansions and robust market presence.
Verisk Analytics, on the other hand, experienced a steady increase of around 75% in gross profits, peaking at $1.94 billion in 2021. However, data for 2024 is missing, indicating potential challenges or strategic shifts.
These insights highlight the dynamic nature of financial performance in different sectors, offering valuable lessons for investors and analysts alike.
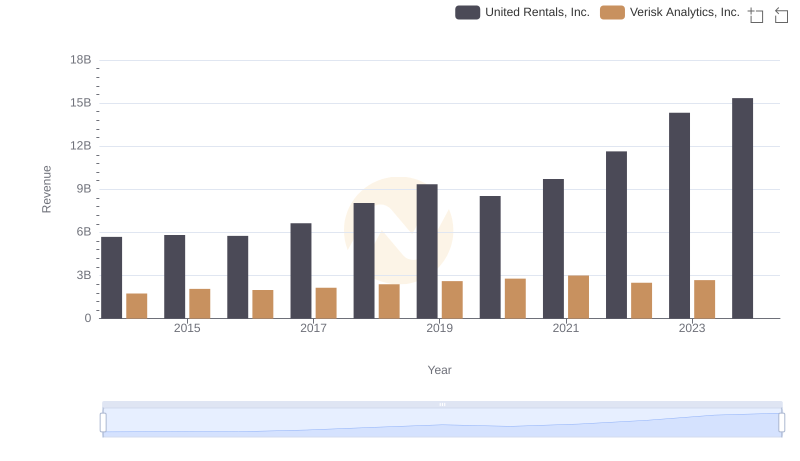
Revenue Insights: United Rentals, Inc. and Verisk Analytics, Inc. Performance Compared
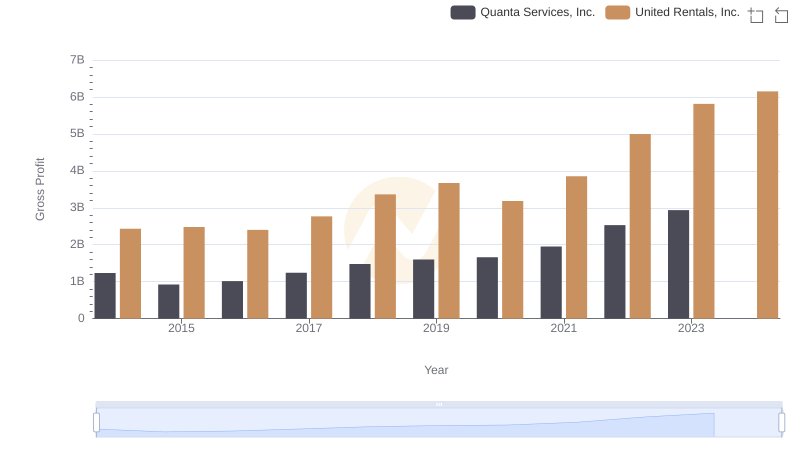
Gross Profit Comparison: United Rentals, Inc. and Quanta Services, Inc. Trends
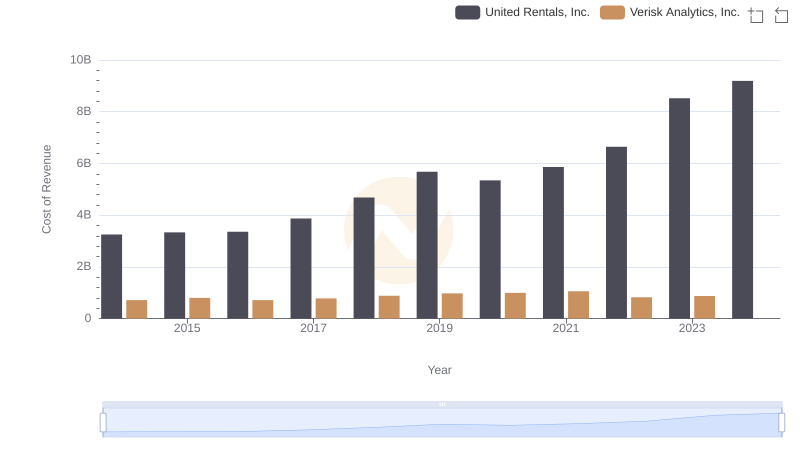
Cost of Revenue Comparison: United Rentals, Inc. vs Verisk Analytics, Inc.
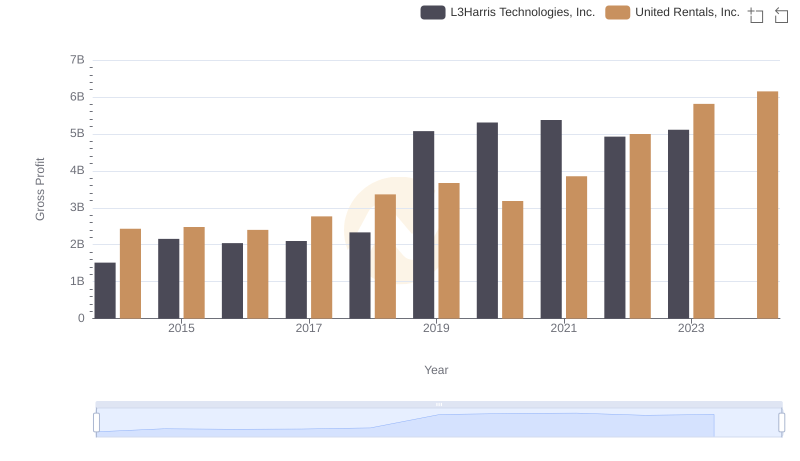
United Rentals, Inc. vs L3Harris Technologies, Inc.: A Gross Profit Performance Breakdown
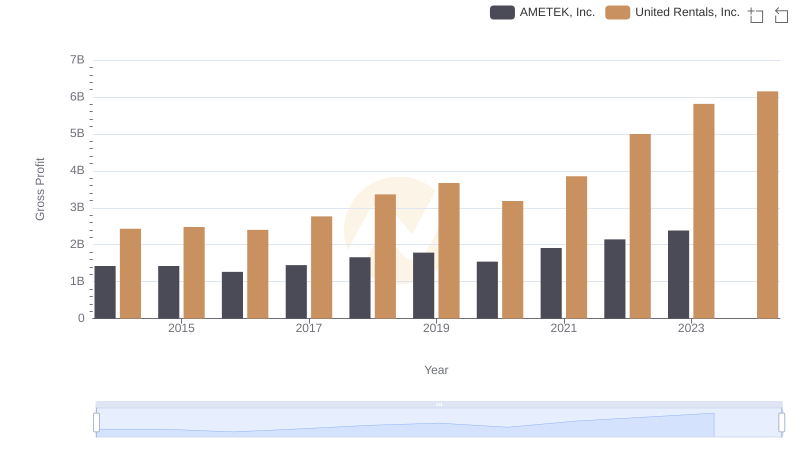
Gross Profit Analysis: Comparing United Rentals, Inc. and AMETEK, Inc.
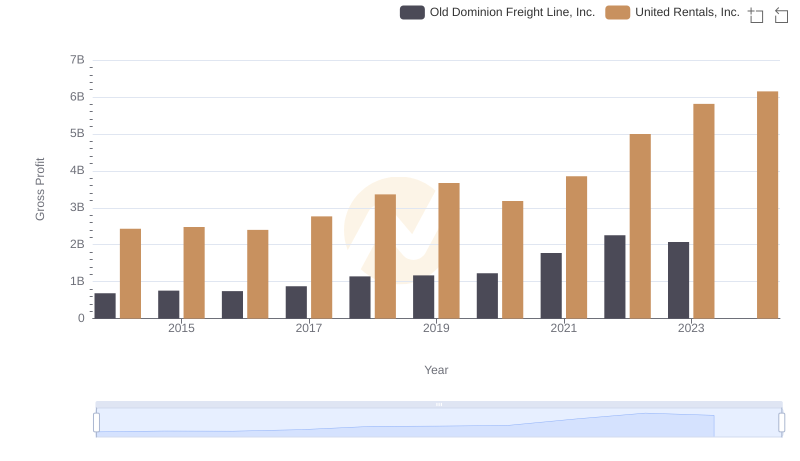
Gross Profit Comparison: United Rentals, Inc. and Old Dominion Freight Line, Inc. Trends
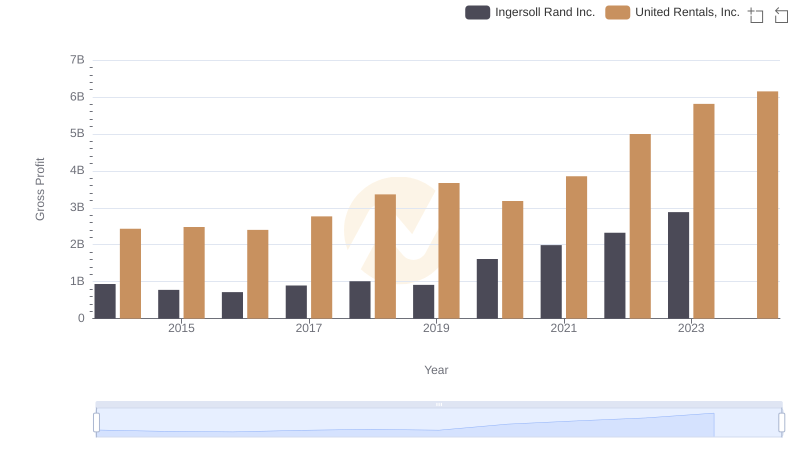
United Rentals, Inc. and Ingersoll Rand Inc.: A Detailed Gross Profit Analysis
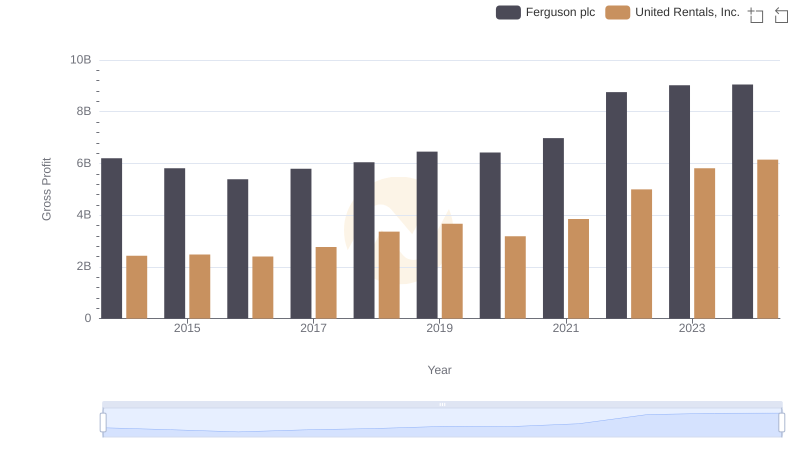
Key Insights on Gross Profit: United Rentals, Inc. vs Ferguson plc
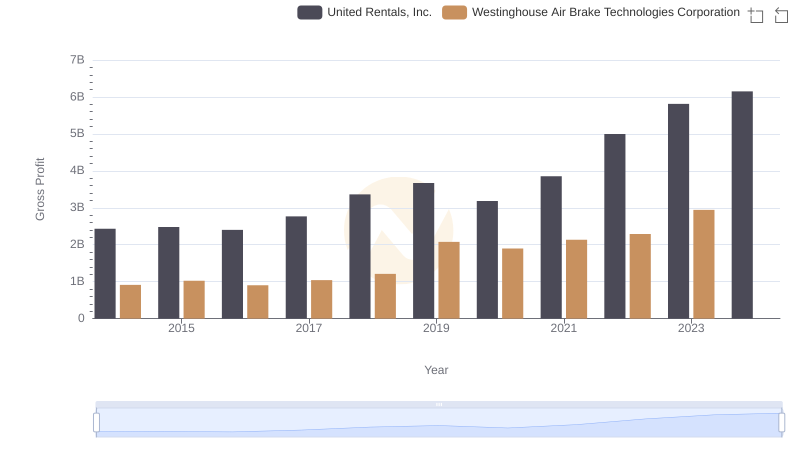
United Rentals, Inc. and Westinghouse Air Brake Technologies Corporation: A Detailed Gross Profit Analysis
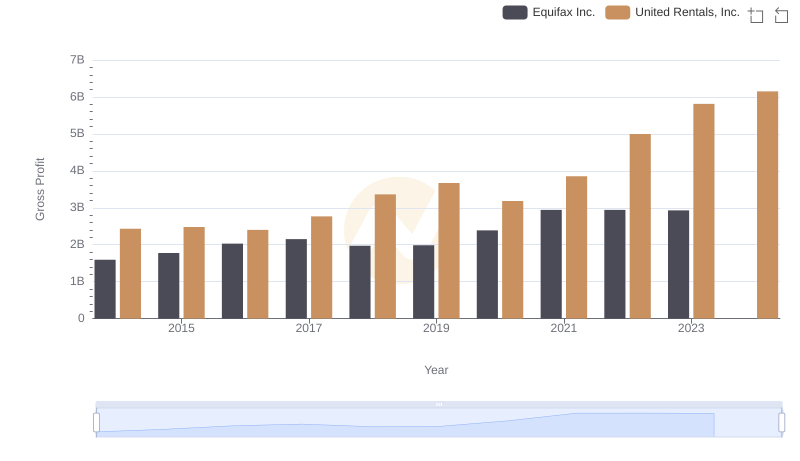
Gross Profit Comparison: United Rentals, Inc. and Equifax Inc. Trends
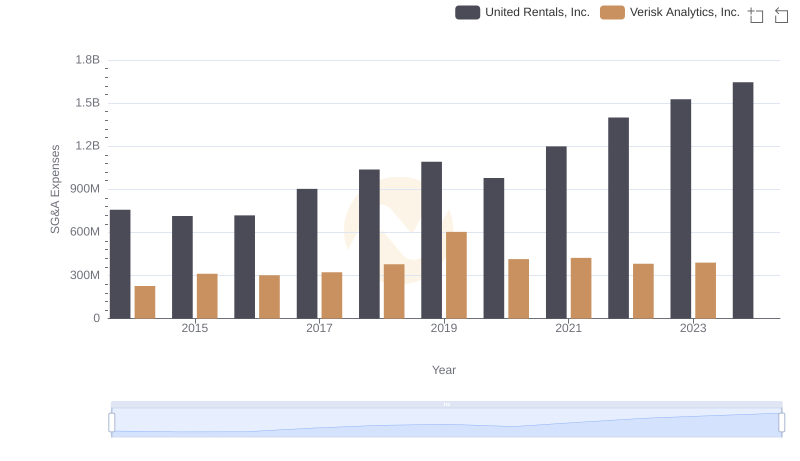
Operational Costs Compared: SG&A Analysis of United Rentals, Inc. and Verisk Analytics, Inc.
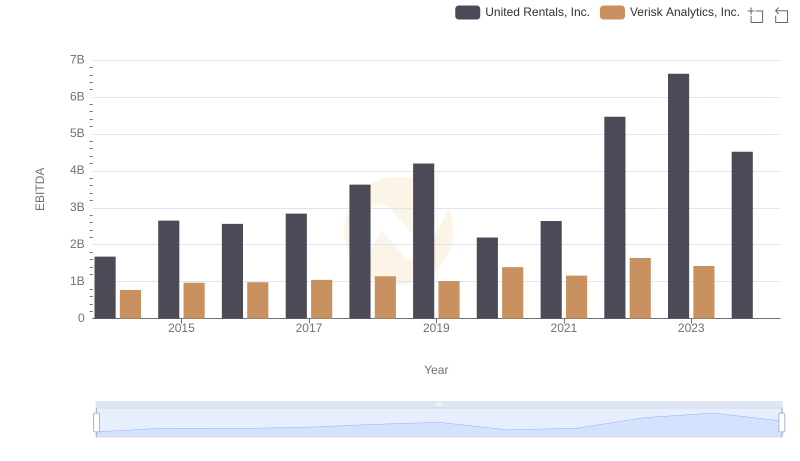
United Rentals, Inc. and Verisk Analytics, Inc.: A Detailed Examination of EBITDA Performance