| __timestamp | AMETEK, Inc. | United Rentals, Inc. |
|---|---|---|
| Wednesday, January 1, 2014 | 2597017000 | 3253000000 |
| Thursday, January 1, 2015 | 2549280000 | 3337000000 |
| Friday, January 1, 2016 | 2575220000 | 3359000000 |
| Sunday, January 1, 2017 | 2851431000 | 3872000000 |
| Monday, January 1, 2018 | 3186310000 | 4683000000 |
| Tuesday, January 1, 2019 | 3370897000 | 5681000000 |
| Wednesday, January 1, 2020 | 2996515000 | 5347000000 |
| Friday, January 1, 2021 | 3633900000 | 5863000000 |
| Saturday, January 1, 2022 | 4005261000 | 6646000000 |
| Sunday, January 1, 2023 | 4212484999 | 8519000000 |
| Monday, January 1, 2024 | 0 | 9195000000 |
Igniting the spark of knowledge
In the ever-evolving landscape of industrial services, cost efficiency remains a pivotal factor for success. Over the past decade, United Rentals, Inc. and AMETEK, Inc. have showcased contrasting trajectories in their cost of revenue. From 2014 to 2023, United Rentals has seen a staggering 162% increase in its cost of revenue, peaking at $8.5 billion in 2023. This growth reflects its aggressive expansion and market dominance. In contrast, AMETEK's cost of revenue grew by approximately 62%, reaching $4.2 billion in 2023, indicating a more stable and controlled growth strategy. Notably, 2024 data for AMETEK is missing, leaving room for speculation on its future performance. This comparison highlights the diverse strategies employed by these industry giants, offering insights into their operational efficiencies and market positioning.
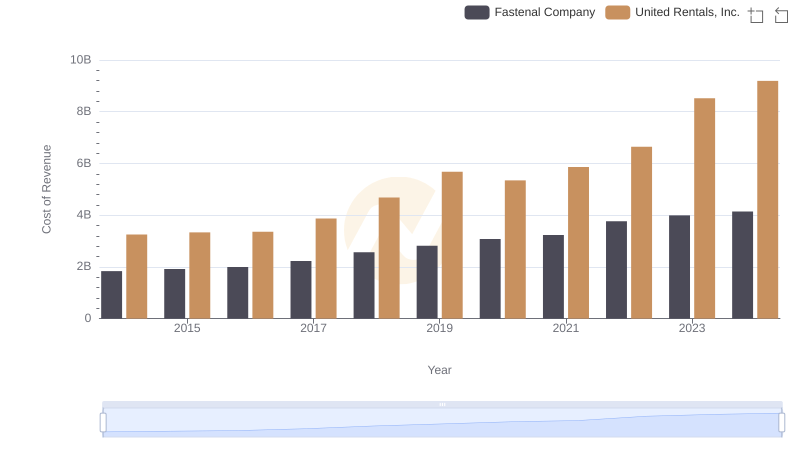
Cost Insights: Breaking Down United Rentals, Inc. and Fastenal Company's Expenses
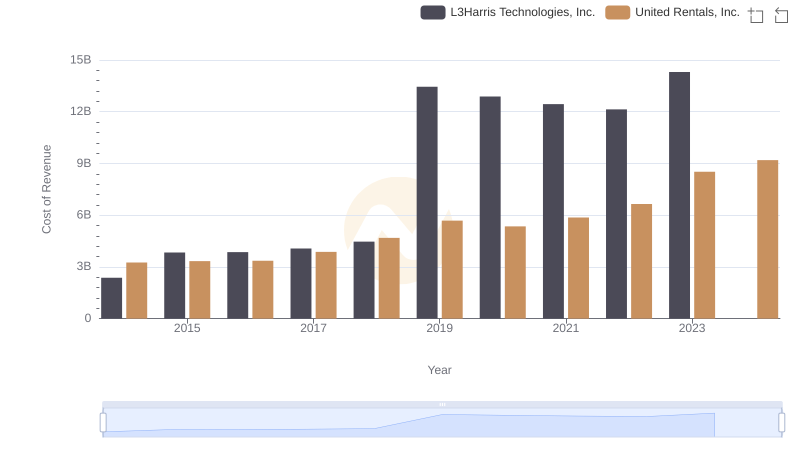
United Rentals, Inc. vs L3Harris Technologies, Inc.: Efficiency in Cost of Revenue Explored
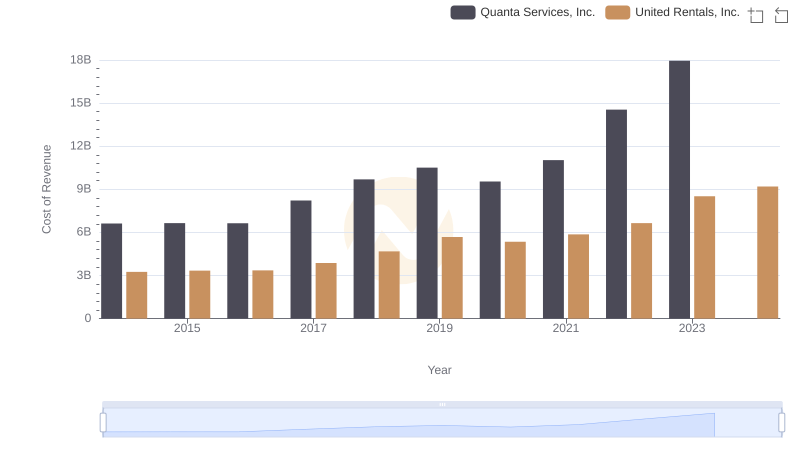
United Rentals, Inc. vs Quanta Services, Inc.: Efficiency in Cost of Revenue Explored
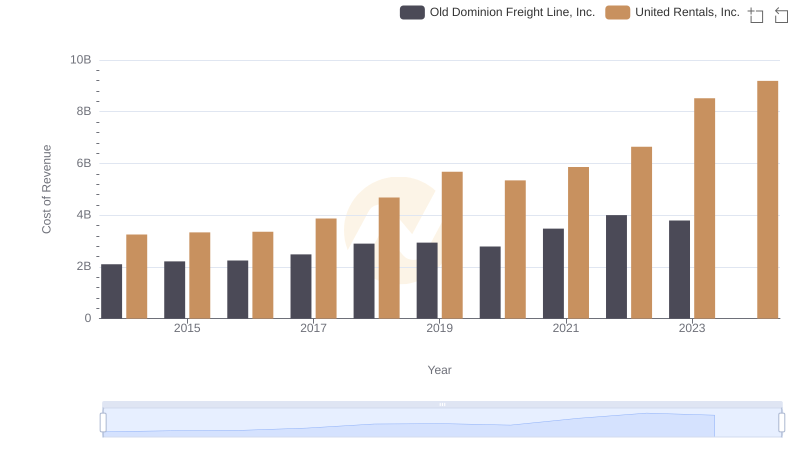
United Rentals, Inc. vs Old Dominion Freight Line, Inc.: Efficiency in Cost of Revenue Explored
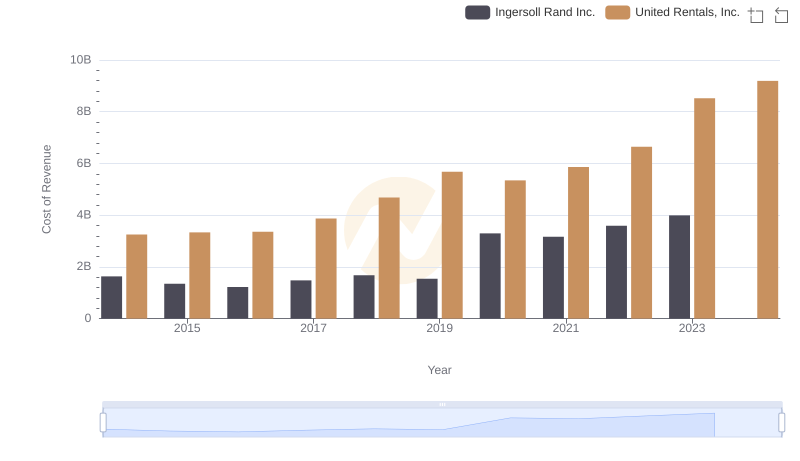
Cost of Revenue Trends: United Rentals, Inc. vs Ingersoll Rand Inc.
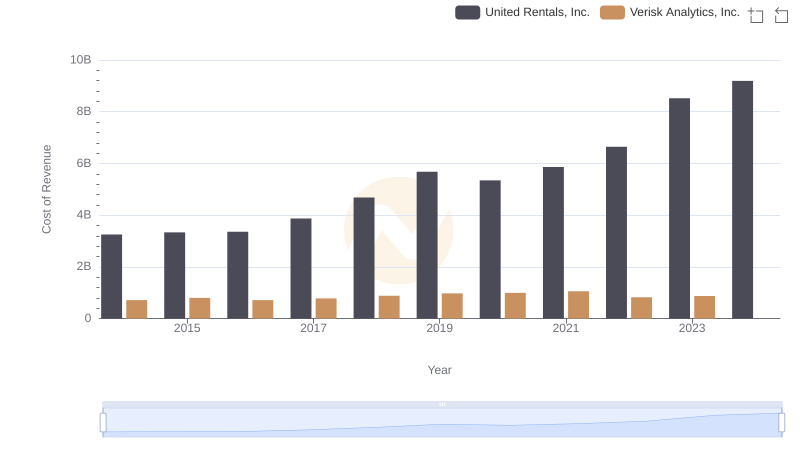
Cost of Revenue Comparison: United Rentals, Inc. vs Verisk Analytics, Inc.
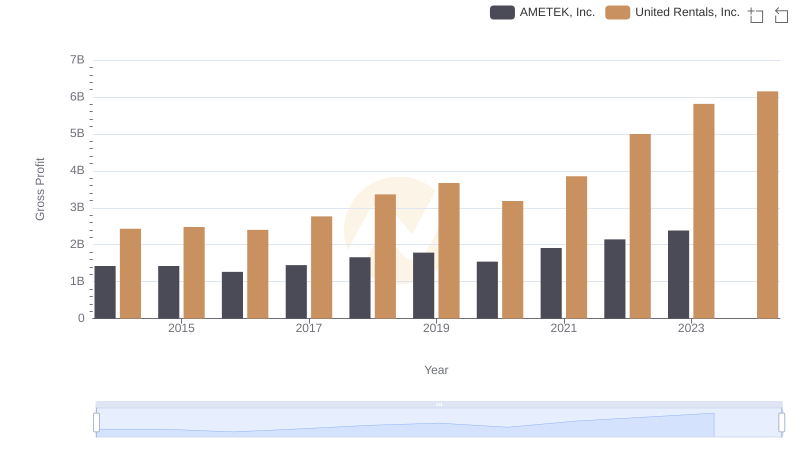
Gross Profit Analysis: Comparing United Rentals, Inc. and AMETEK, Inc.
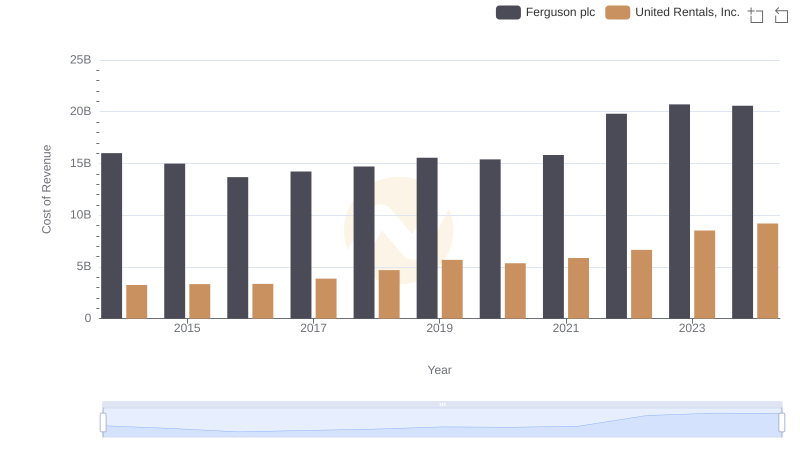
Cost of Revenue Comparison: United Rentals, Inc. vs Ferguson plc
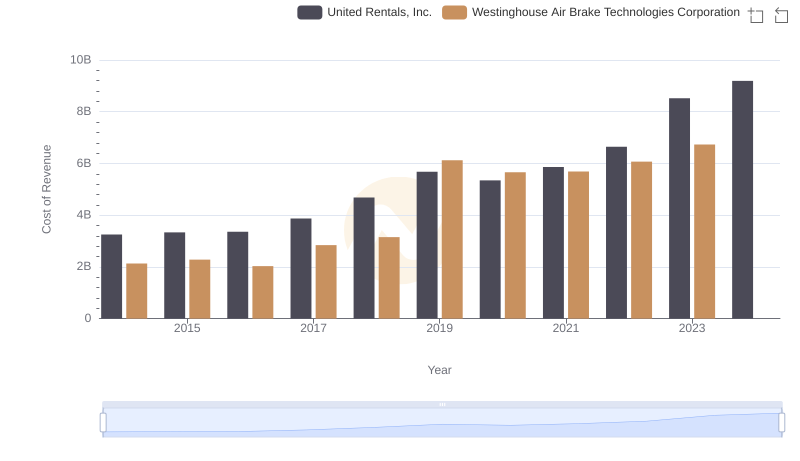
United Rentals, Inc. vs Westinghouse Air Brake Technologies Corporation: Efficiency in Cost of Revenue Explored
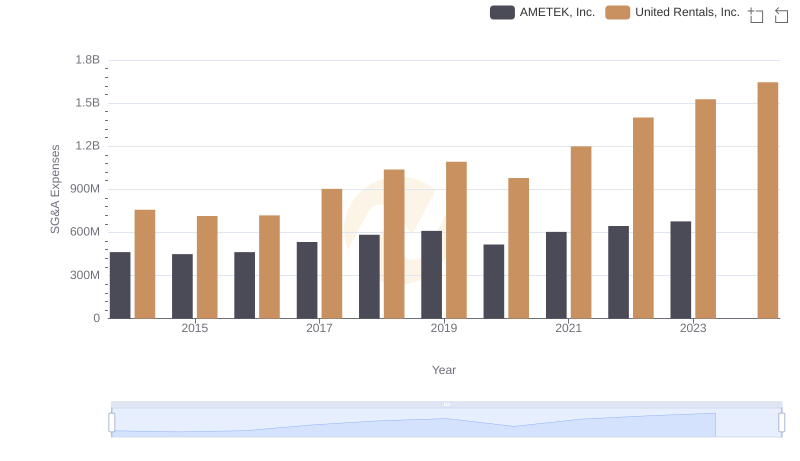
United Rentals, Inc. vs AMETEK, Inc.: SG&A Expense Trends
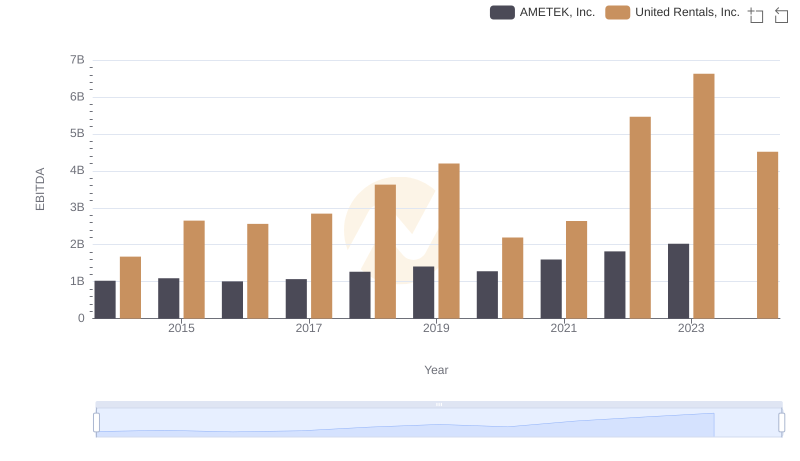
A Side-by-Side Analysis of EBITDA: United Rentals, Inc. and AMETEK, Inc.