| __timestamp | Ingersoll Rand Inc. | United Rentals, Inc. |
|---|---|---|
| Wednesday, January 1, 2014 | 1633224000 | 3253000000 |
| Thursday, January 1, 2015 | 1347800000 | 3337000000 |
| Friday, January 1, 2016 | 1222705000 | 3359000000 |
| Sunday, January 1, 2017 | 1477500000 | 3872000000 |
| Monday, January 1, 2018 | 1677300000 | 4683000000 |
| Tuesday, January 1, 2019 | 1540200000 | 5681000000 |
| Wednesday, January 1, 2020 | 3296800000 | 5347000000 |
| Friday, January 1, 2021 | 3163900000 | 5863000000 |
| Saturday, January 1, 2022 | 3590700000 | 6646000000 |
| Sunday, January 1, 2023 | 3993900000 | 8519000000 |
| Monday, January 1, 2024 | 0 | 9195000000 |
In pursuit of knowledge
In the ever-evolving landscape of industrial equipment, United Rentals, Inc. and Ingersoll Rand Inc. have showcased distinct trajectories in their cost of revenue over the past decade. Since 2014, United Rentals has consistently outpaced Ingersoll Rand, with a notable 162% increase by 2023, reaching a peak cost of revenue. In contrast, Ingersoll Rand's cost of revenue has seen a more modest growth of approximately 145% over the same period. The year 2020 marked a significant surge for Ingersoll Rand, with a 114% increase from the previous year, reflecting strategic shifts in their operational model. Meanwhile, United Rentals maintained a steady upward trend, culminating in a remarkable 28% rise in 2023 alone. This data underscores the dynamic strategies employed by these industry giants, highlighting United Rentals' aggressive expansion and Ingersoll Rand's adaptive resilience. As we look to the future, these trends offer valuable insights into the competitive landscape of industrial equipment.
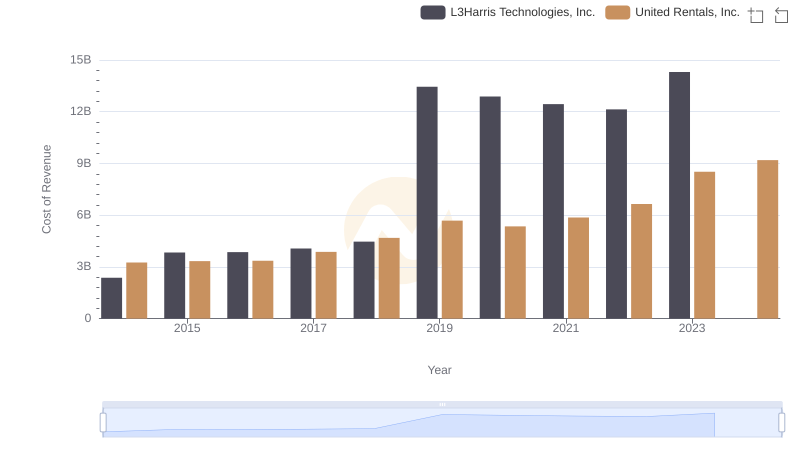
United Rentals, Inc. vs L3Harris Technologies, Inc.: Efficiency in Cost of Revenue Explored
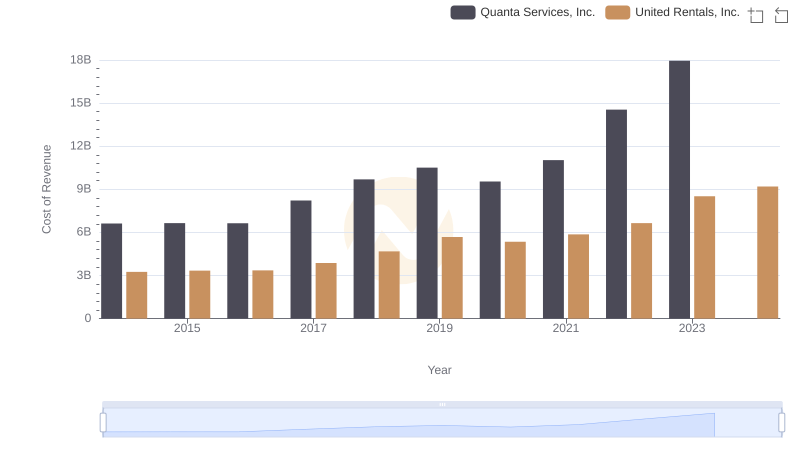
United Rentals, Inc. vs Quanta Services, Inc.: Efficiency in Cost of Revenue Explored
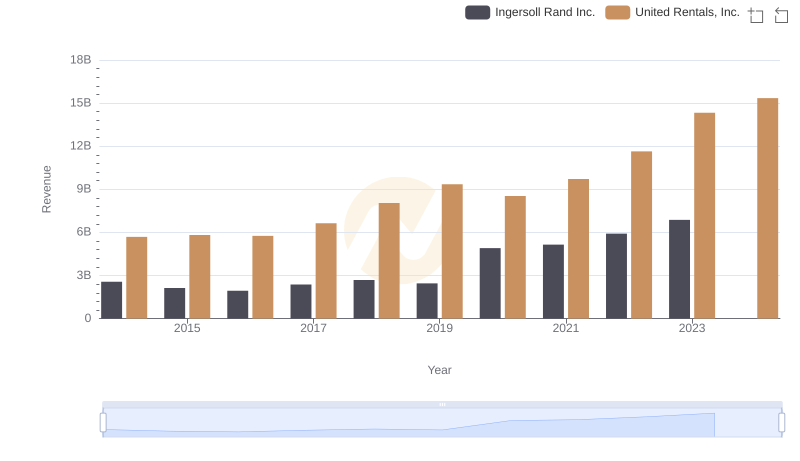
United Rentals, Inc. vs Ingersoll Rand Inc.: Examining Key Revenue Metrics
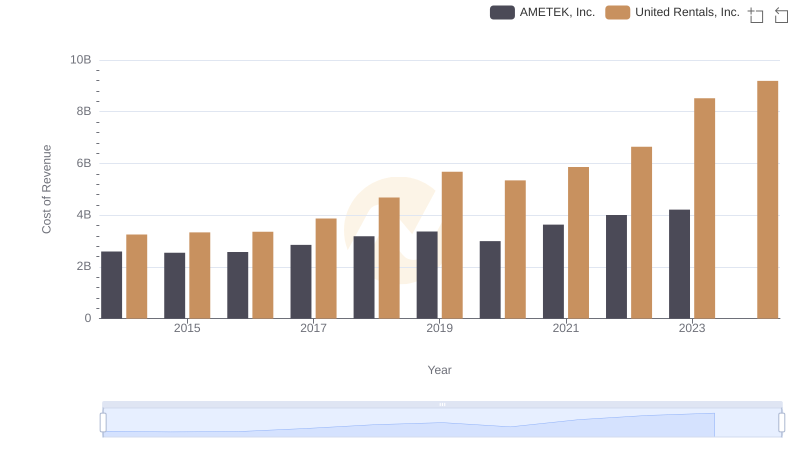
Comparing Cost of Revenue Efficiency: United Rentals, Inc. vs AMETEK, Inc.
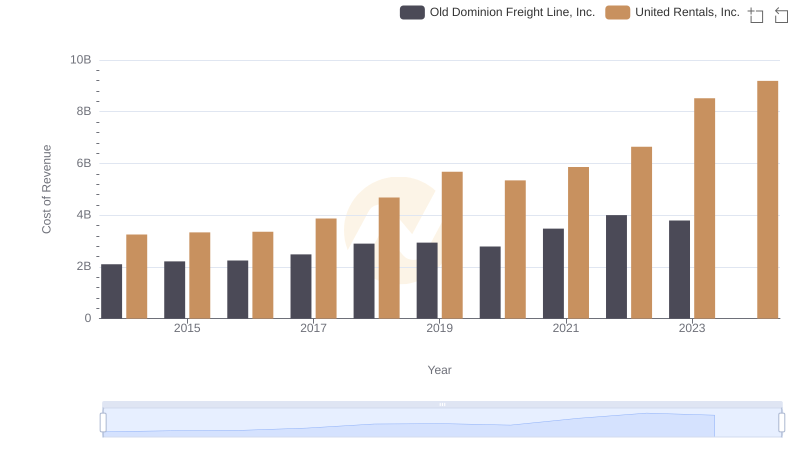
United Rentals, Inc. vs Old Dominion Freight Line, Inc.: Efficiency in Cost of Revenue Explored
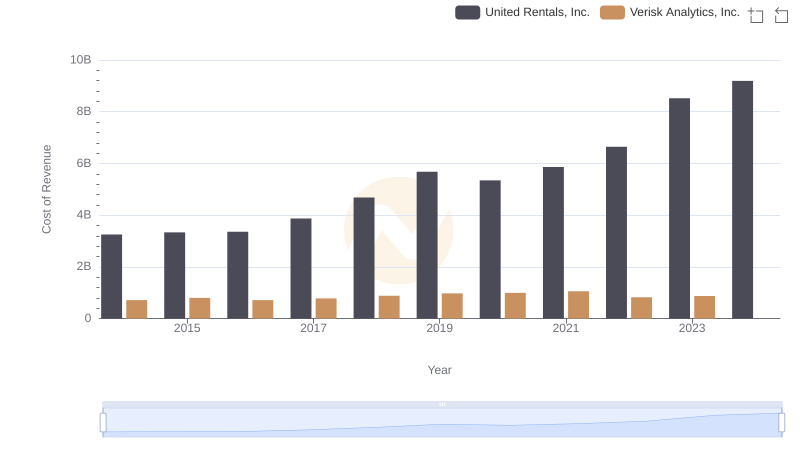
Cost of Revenue Comparison: United Rentals, Inc. vs Verisk Analytics, Inc.
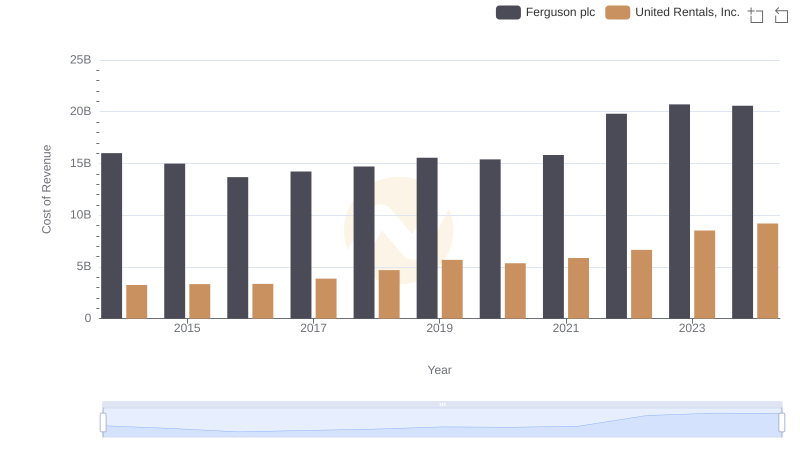
Cost of Revenue Comparison: United Rentals, Inc. vs Ferguson plc
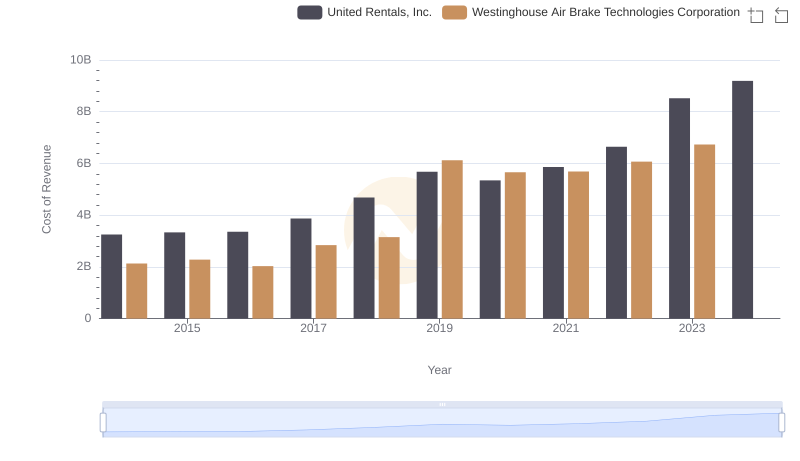
United Rentals, Inc. vs Westinghouse Air Brake Technologies Corporation: Efficiency in Cost of Revenue Explored
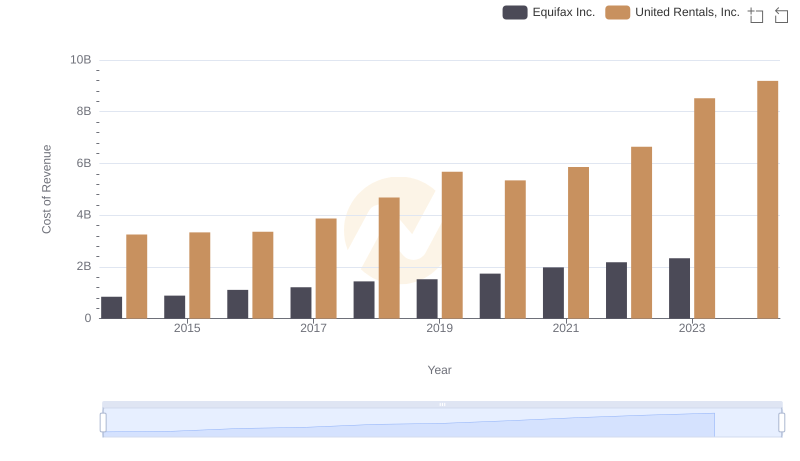
United Rentals, Inc. vs Equifax Inc.: Efficiency in Cost of Revenue Explored
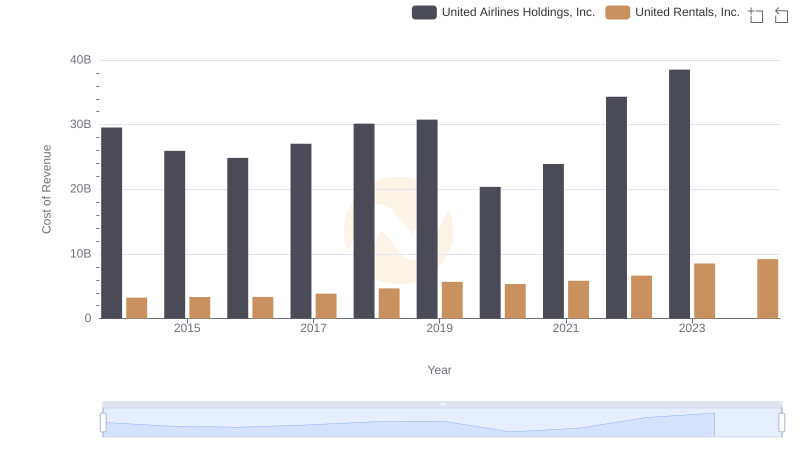
Cost Insights: Breaking Down United Rentals, Inc. and United Airlines Holdings, Inc.'s Expenses
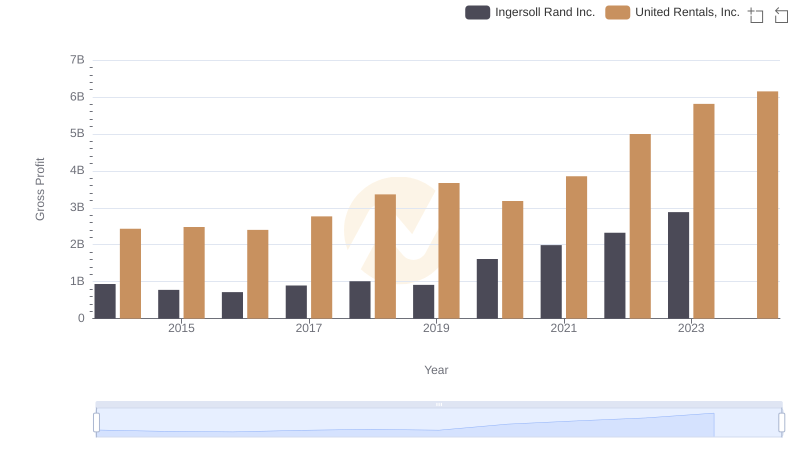
United Rentals, Inc. and Ingersoll Rand Inc.: A Detailed Gross Profit Analysis
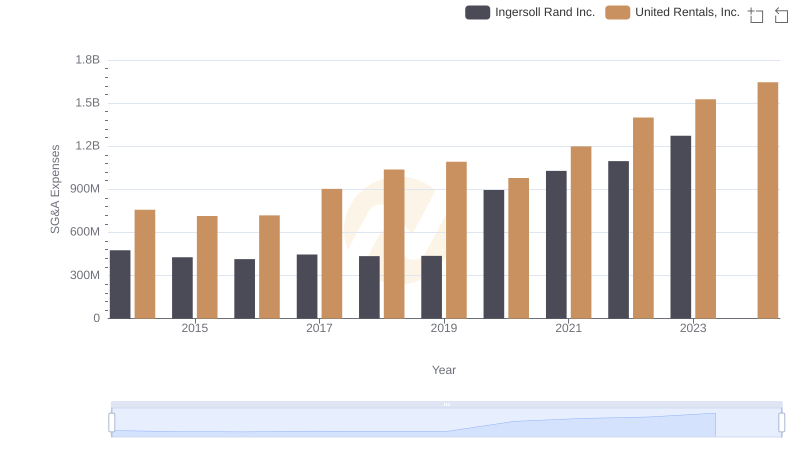
United Rentals, Inc. and Ingersoll Rand Inc.: SG&A Spending Patterns Compared