| __timestamp | RB Global, Inc. | United Rentals, Inc. |
|---|---|---|
| Wednesday, January 1, 2014 | 57884000 | 3253000000 |
| Thursday, January 1, 2015 | 56026000 | 3337000000 |
| Friday, January 1, 2016 | 66062000 | 3359000000 |
| Sunday, January 1, 2017 | 79013000 | 3872000000 |
| Monday, January 1, 2018 | 533397000 | 4683000000 |
| Tuesday, January 1, 2019 | 645816000 | 5681000000 |
| Wednesday, January 1, 2020 | 615589000 | 5347000000 |
| Friday, January 1, 2021 | 594783000 | 5863000000 |
| Saturday, January 1, 2022 | 776701000 | 6646000000 |
| Sunday, January 1, 2023 | 1901200000 | 8519000000 |
| Monday, January 1, 2024 | 0 | 9195000000 |
Infusing magic into the data realm
In the competitive landscape of the equipment rental industry, United Rentals, Inc. and RB Global, Inc. have been pivotal players. Over the past decade, United Rentals has consistently outpaced RB Global in terms of cost of revenue, reflecting its expansive operations and market dominance. From 2014 to 2023, United Rentals' cost of revenue surged by approximately 162%, peaking in 2023. In contrast, RB Global experienced a more modest growth of around 228% during the same period, with a significant leap in 2023. This disparity highlights United Rentals' aggressive expansion strategy, while RB Global's recent spike suggests a strategic pivot or market adaptation. Notably, data for 2024 is incomplete, leaving room for speculation on future trends. As these industry titans continue to evolve, stakeholders and analysts alike will be keenly observing their financial maneuvers.
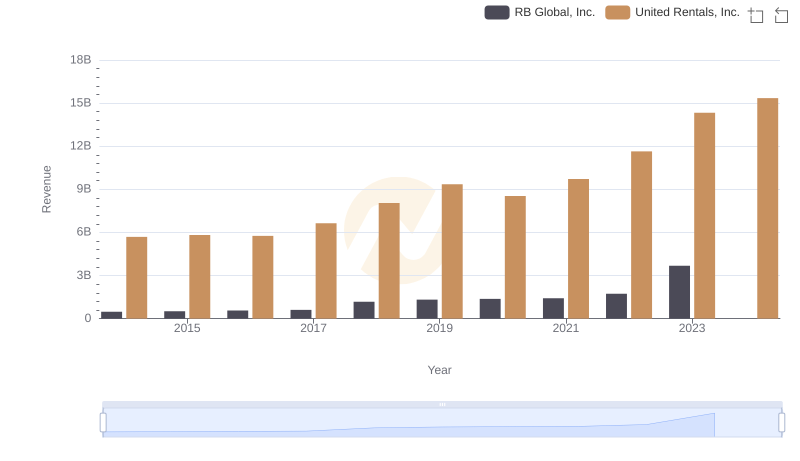
Revenue Insights: United Rentals, Inc. and RB Global, Inc. Performance Compared
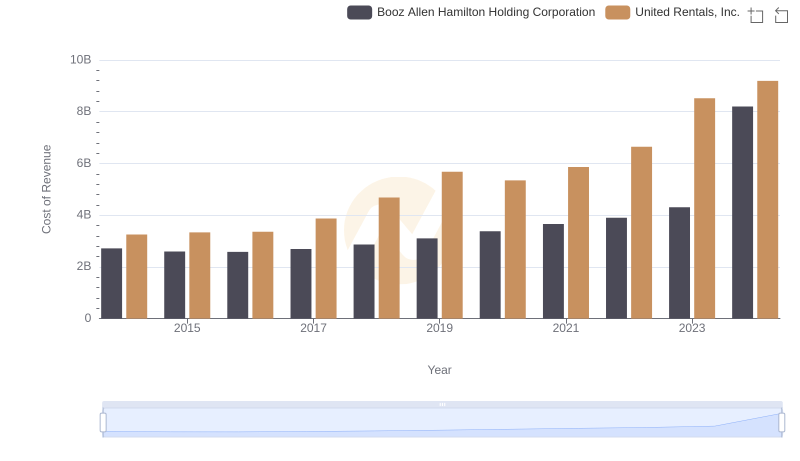
Cost of Revenue: Key Insights for United Rentals, Inc. and Booz Allen Hamilton Holding Corporation
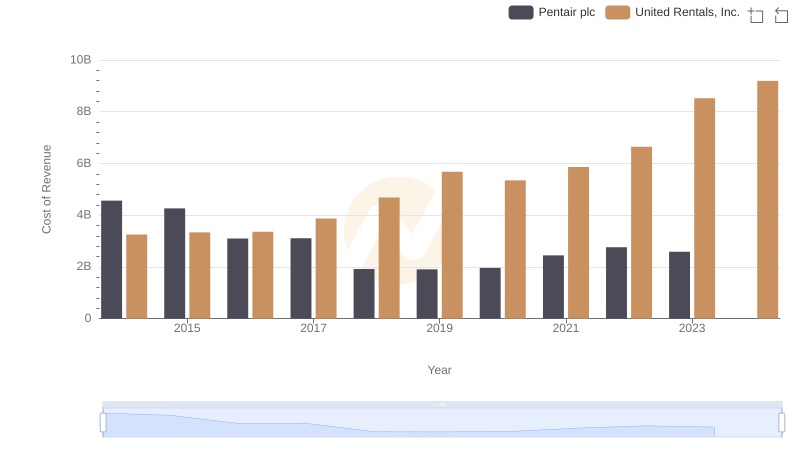
Analyzing Cost of Revenue: United Rentals, Inc. and Pentair plc
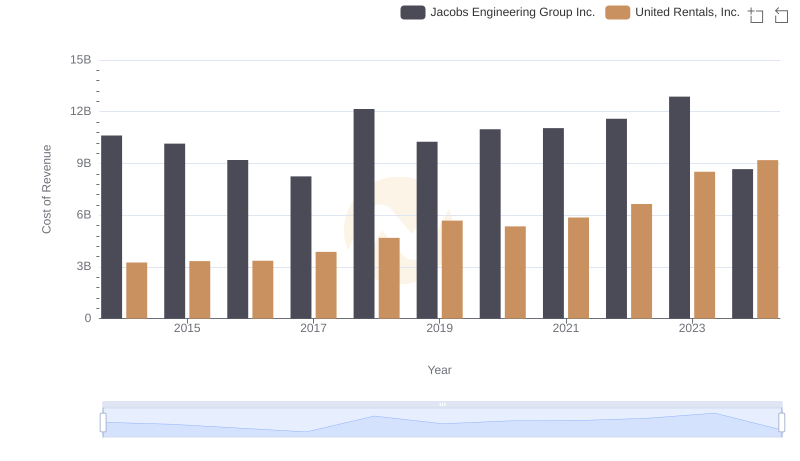
Cost Insights: Breaking Down United Rentals, Inc. and Jacobs Engineering Group Inc.'s Expenses
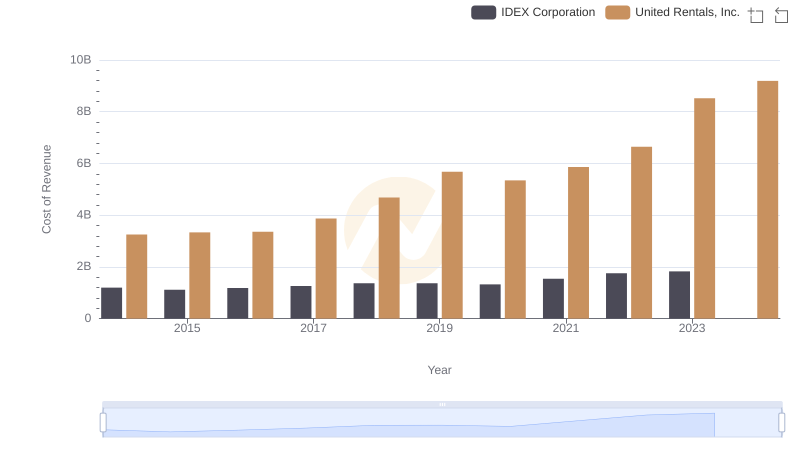
Analyzing Cost of Revenue: United Rentals, Inc. and IDEX Corporation
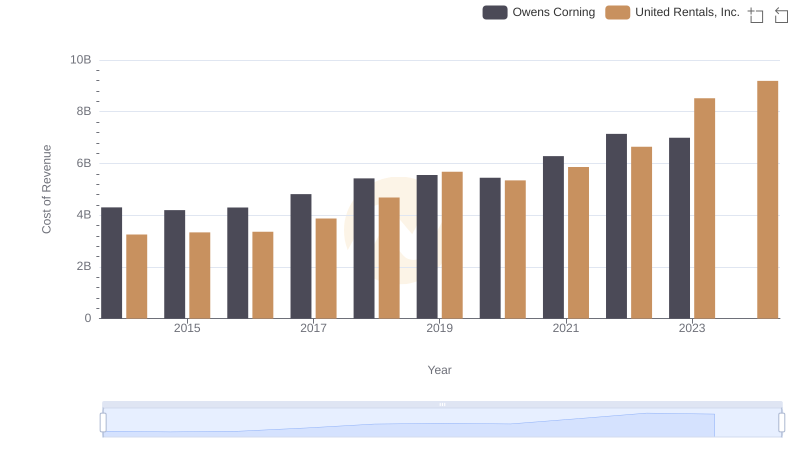
Analyzing Cost of Revenue: United Rentals, Inc. and Owens Corning
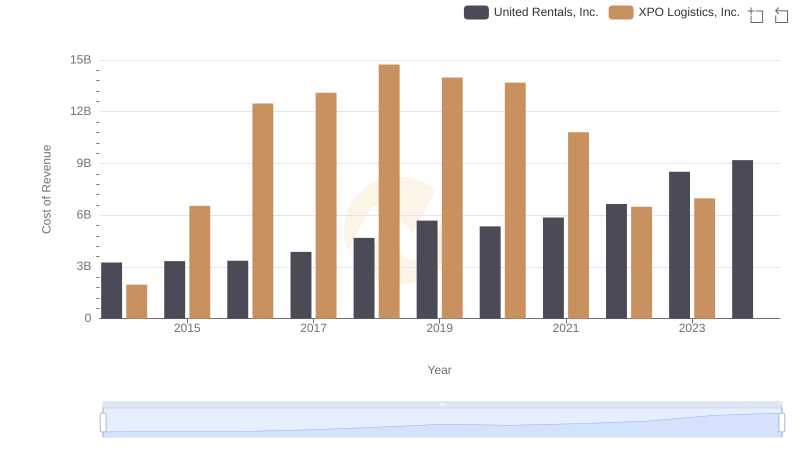
Cost of Revenue Trends: United Rentals, Inc. vs XPO Logistics, Inc.

Cost of Revenue: Key Insights for United Rentals, Inc. and Expeditors International of Washington, Inc.
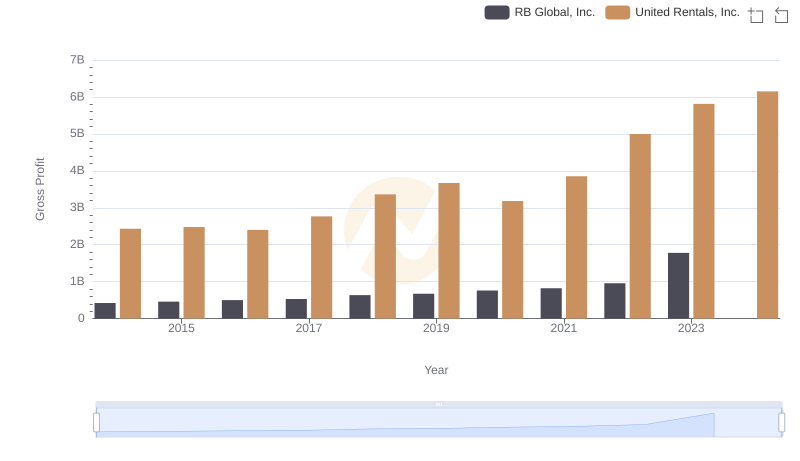
Who Generates Higher Gross Profit? United Rentals, Inc. or RB Global, Inc.
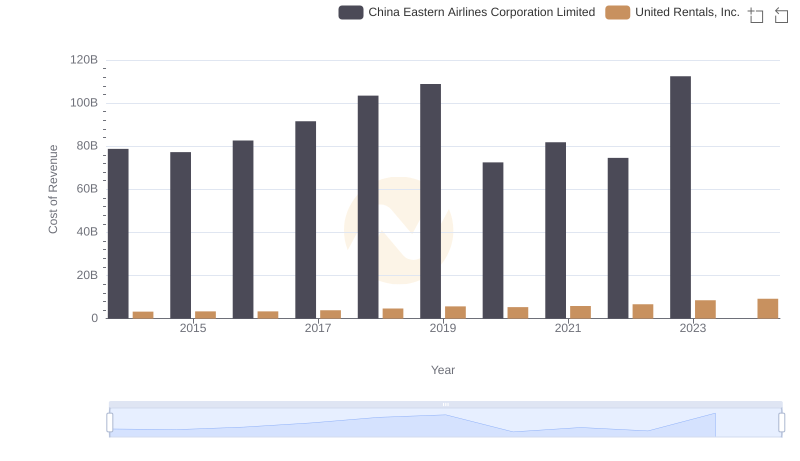
Cost of Revenue: Key Insights for United Rentals, Inc. and China Eastern Airlines Corporation Limited
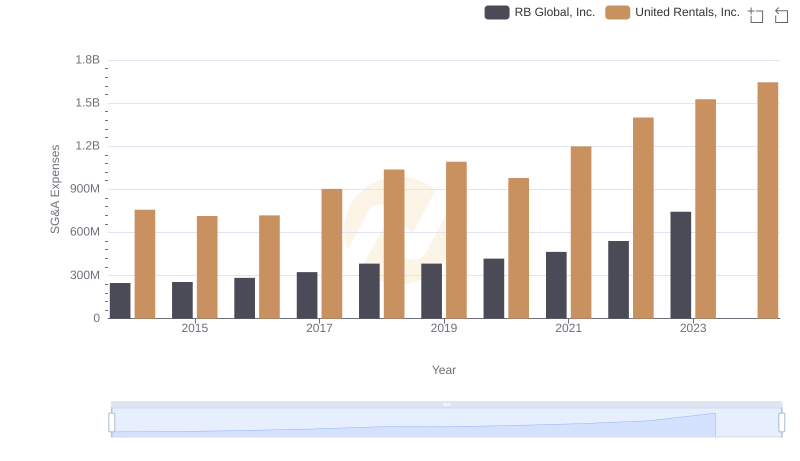
United Rentals, Inc. and RB Global, Inc.: SG&A Spending Patterns Compared
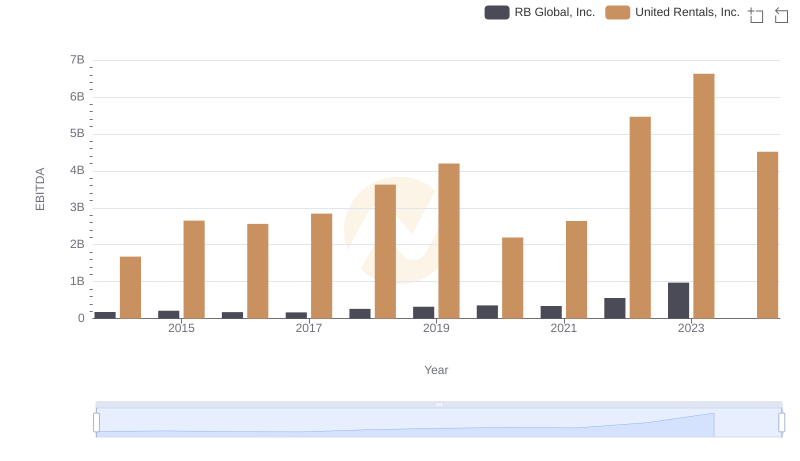
Comprehensive EBITDA Comparison: United Rentals, Inc. vs RB Global, Inc.