| __timestamp | RB Global, Inc. | United Rentals, Inc. |
|---|---|---|
| Wednesday, January 1, 2014 | 178851000 | 1678000000 |
| Thursday, January 1, 2015 | 211417000 | 2653000000 |
| Friday, January 1, 2016 | 174791291 | 2566000000 |
| Sunday, January 1, 2017 | 168379000 | 2843000000 |
| Monday, January 1, 2018 | 263653000 | 3628000000 |
| Tuesday, January 1, 2019 | 322140110 | 4200000000 |
| Wednesday, January 1, 2020 | 358617000 | 2195000000 |
| Friday, January 1, 2021 | 339928424 | 2642000000 |
| Saturday, January 1, 2022 | 557399151 | 5464000000 |
| Sunday, January 1, 2023 | 975874087 | 6627000000 |
| Monday, January 1, 2024 | 761100000 | 4516000000 |
Unleashing insights
In the competitive landscape of equipment rental and auction services, United Rentals, Inc. and RB Global, Inc. have showcased remarkable financial trajectories over the past decade. Since 2014, United Rentals has consistently outperformed RB Global in terms of EBITDA, reflecting its dominant market position. By 2023, United Rentals' EBITDA surged to approximately 6.6 billion, marking a nearly 300% increase from 2014. In contrast, RB Global's EBITDA, while growing, reached around 976 million in 2023, a significant rise from its 2014 figure but still trailing behind United Rentals.
The data highlights a pivotal trend: United Rentals' strategic expansions and acquisitions have fueled its robust growth, while RB Global's steady climb suggests a more conservative approach. Notably, the data for 2024 is incomplete, indicating potential shifts in the coming year. This analysis underscores the dynamic nature of the industry and the strategic maneuvers of its key players.
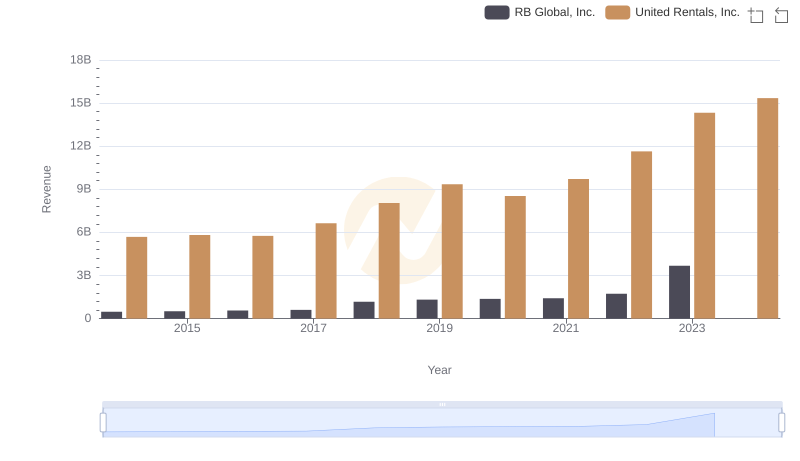
Revenue Insights: United Rentals, Inc. and RB Global, Inc. Performance Compared
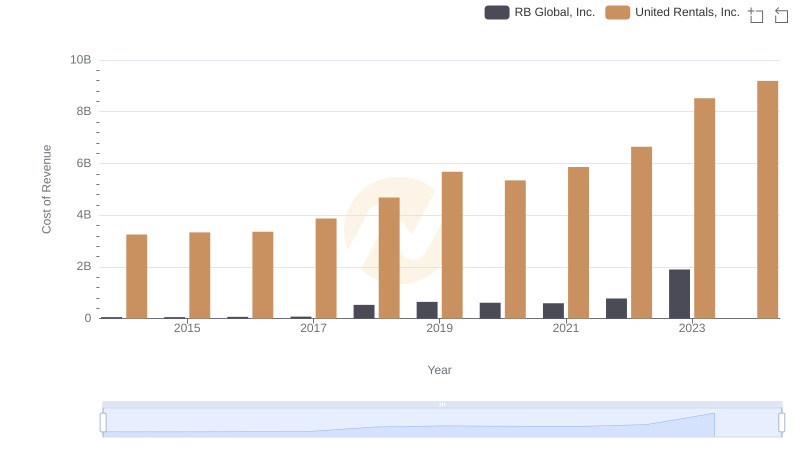
Cost of Revenue Comparison: United Rentals, Inc. vs RB Global, Inc.
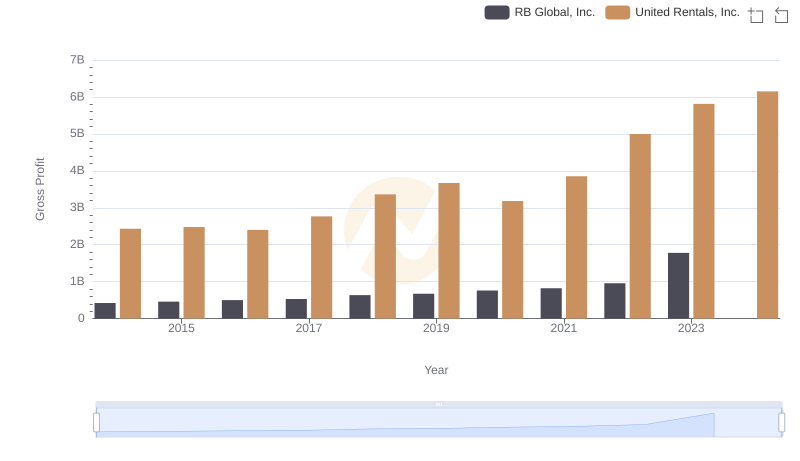
Who Generates Higher Gross Profit? United Rentals, Inc. or RB Global, Inc.
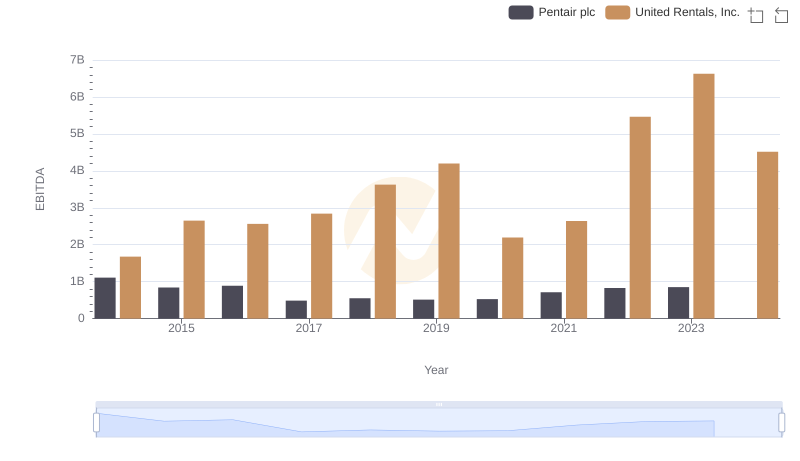
Comprehensive EBITDA Comparison: United Rentals, Inc. vs Pentair plc
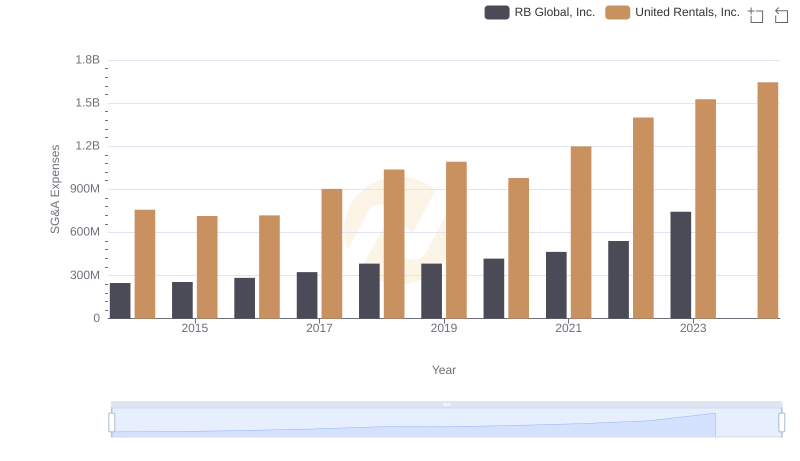
United Rentals, Inc. and RB Global, Inc.: SG&A Spending Patterns Compared

Comparative EBITDA Analysis: United Rentals, Inc. vs IDEX Corporation
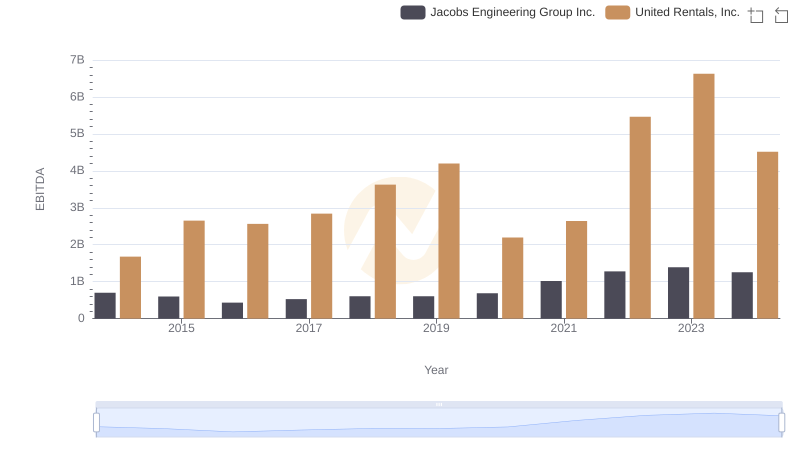
EBITDA Performance Review: United Rentals, Inc. vs Jacobs Engineering Group Inc.
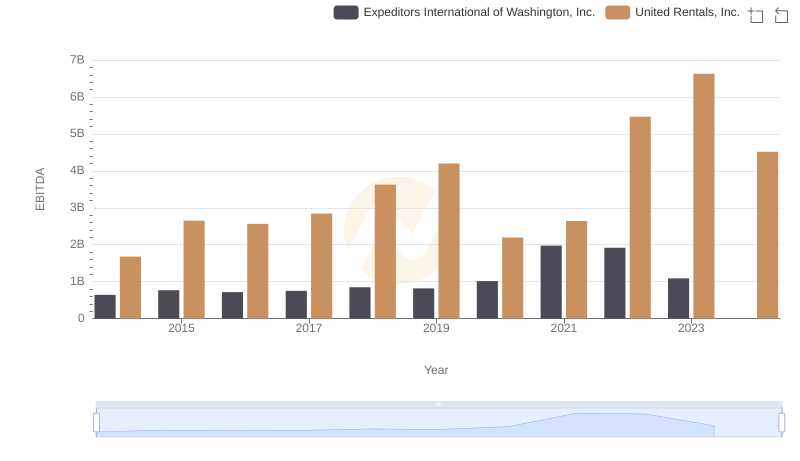
A Side-by-Side Analysis of EBITDA: United Rentals, Inc. and Expeditors International of Washington, Inc.

United Rentals, Inc. vs Owens Corning: In-Depth EBITDA Performance Comparison
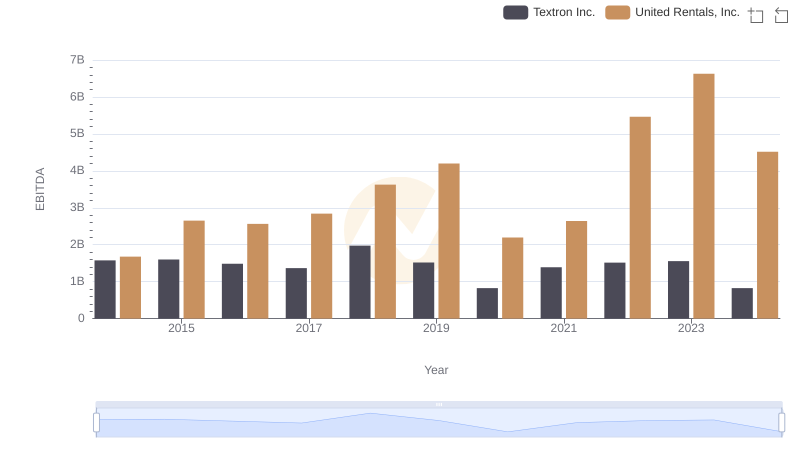
United Rentals, Inc. vs Textron Inc.: In-Depth EBITDA Performance Comparison
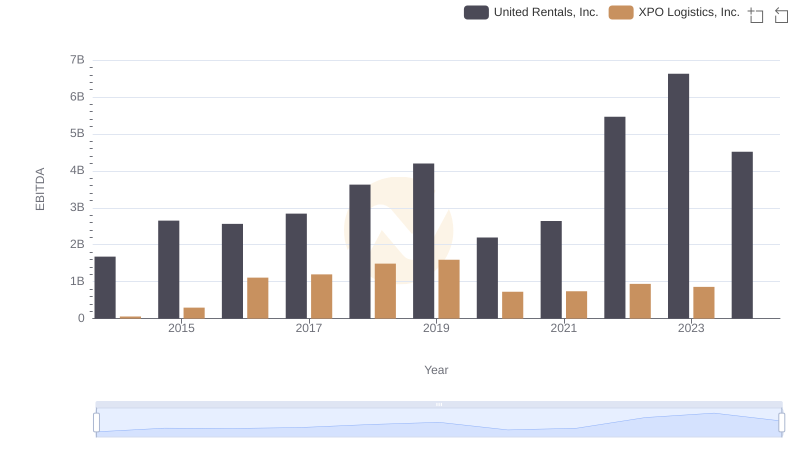
EBITDA Performance Review: United Rentals, Inc. vs XPO Logistics, Inc.