| __timestamp | RB Global, Inc. | United Rentals, Inc. |
|---|---|---|
| Wednesday, January 1, 2014 | 481097000 | 5685000000 |
| Thursday, January 1, 2015 | 515875000 | 5817000000 |
| Friday, January 1, 2016 | 566395000 | 5762000000 |
| Sunday, January 1, 2017 | 610517000 | 6641000000 |
| Monday, January 1, 2018 | 1170026000 | 8047000000 |
| Tuesday, January 1, 2019 | 1318641000 | 9351000000 |
| Wednesday, January 1, 2020 | 1377260000 | 8530000000 |
| Friday, January 1, 2021 | 1416971000 | 9716000000 |
| Saturday, January 1, 2022 | 1733808000 | 11642000000 |
| Sunday, January 1, 2023 | 3679600000 | 14332000000 |
| Monday, January 1, 2024 | 4284200000 | 15345000000 |
Igniting the spark of knowledge
In the competitive landscape of industrial equipment rental, United Rentals, Inc. and RB Global, Inc. have showcased remarkable revenue trajectories over the past decade. Since 2014, United Rentals has consistently outperformed RB Global, with revenues soaring by approximately 170% by 2023. This growth underscores United Rentals' strategic market positioning and robust operational execution.
RB Global, while trailing, has demonstrated a commendable revenue increase of over 660% during the same period, reflecting its resilience and adaptability in a dynamic market. Notably, 2023 marked a significant leap for RB Global, with revenues nearly doubling from the previous year, hinting at potential strategic shifts or market expansions.
As we look to the future, the absence of 2024 data for RB Global leaves room for speculation. Will RB Global continue its upward trajectory, or will United Rentals maintain its lead? The coming years will be pivotal for both industry giants.
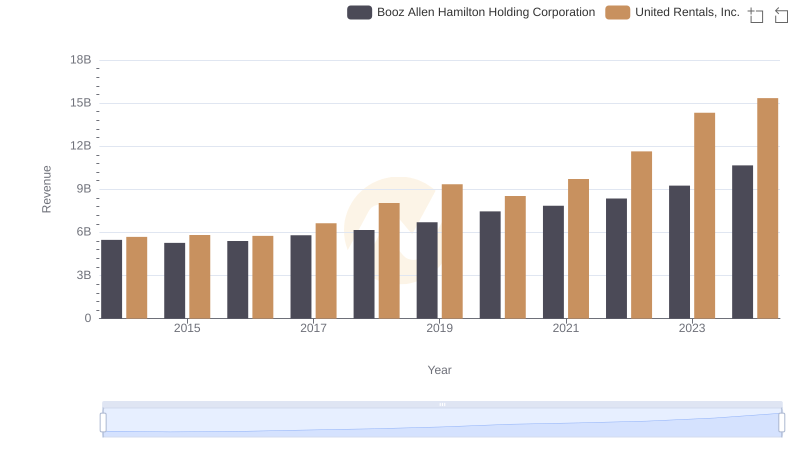
United Rentals, Inc. and Booz Allen Hamilton Holding Corporation: A Comprehensive Revenue Analysis
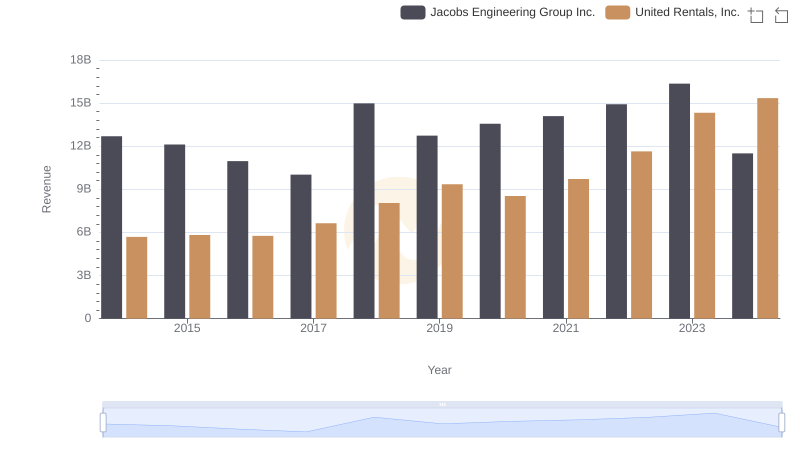
United Rentals, Inc. vs Jacobs Engineering Group Inc.: Annual Revenue Growth Compared
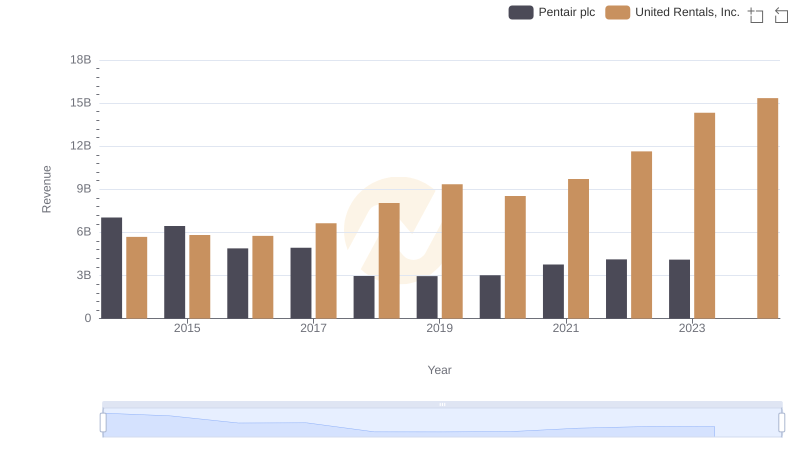
Revenue Showdown: United Rentals, Inc. vs Pentair plc
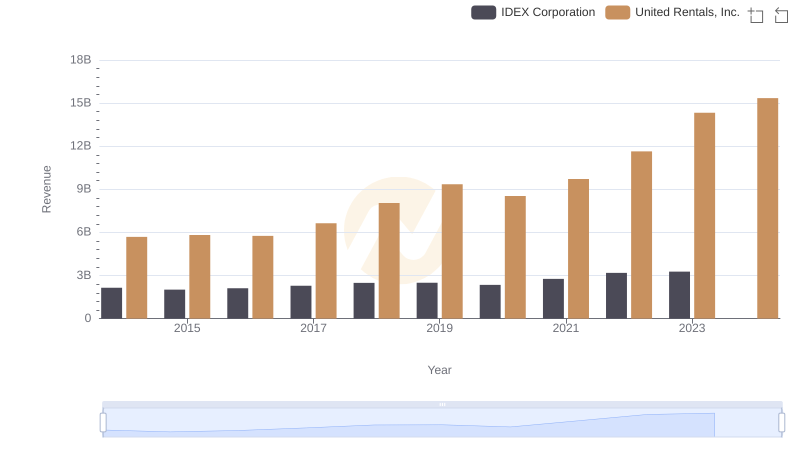
United Rentals, Inc. and IDEX Corporation: A Comprehensive Revenue Analysis
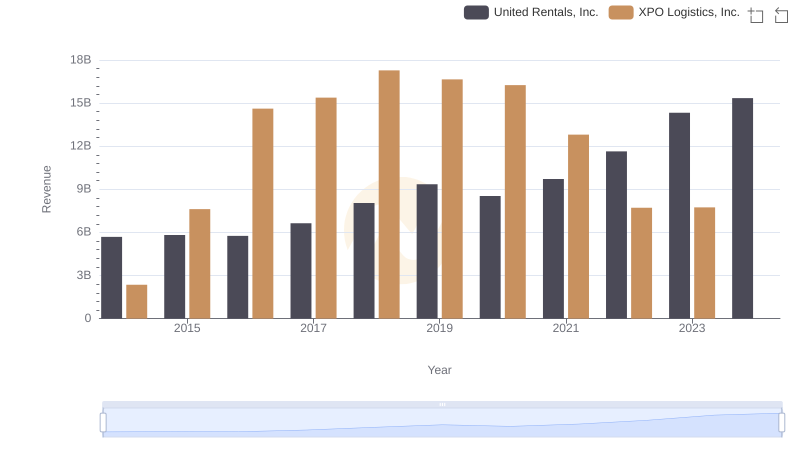
United Rentals, Inc. and XPO Logistics, Inc.: A Comprehensive Revenue Analysis
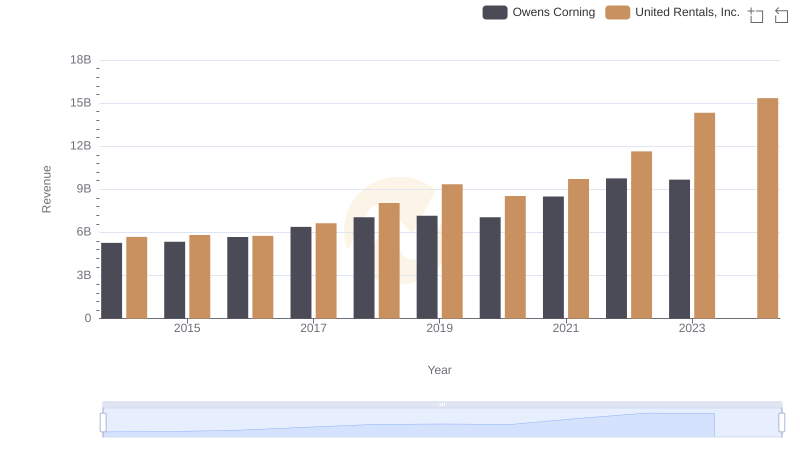
United Rentals, Inc. vs Owens Corning: Annual Revenue Growth Compared
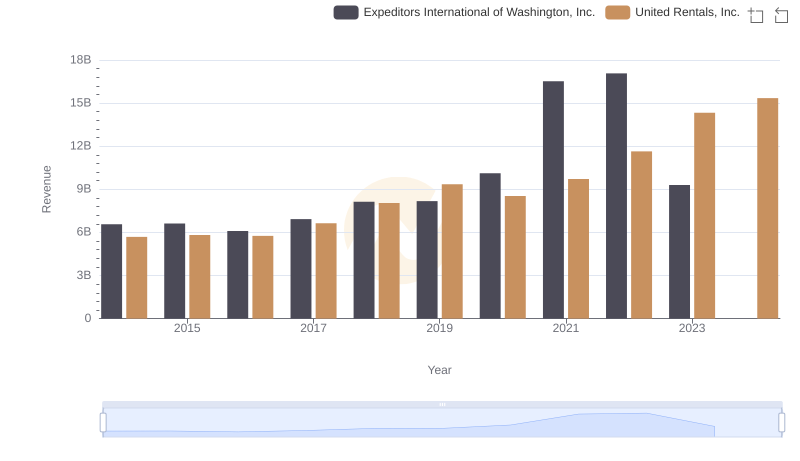
Comparing Revenue Performance: United Rentals, Inc. or Expeditors International of Washington, Inc.?
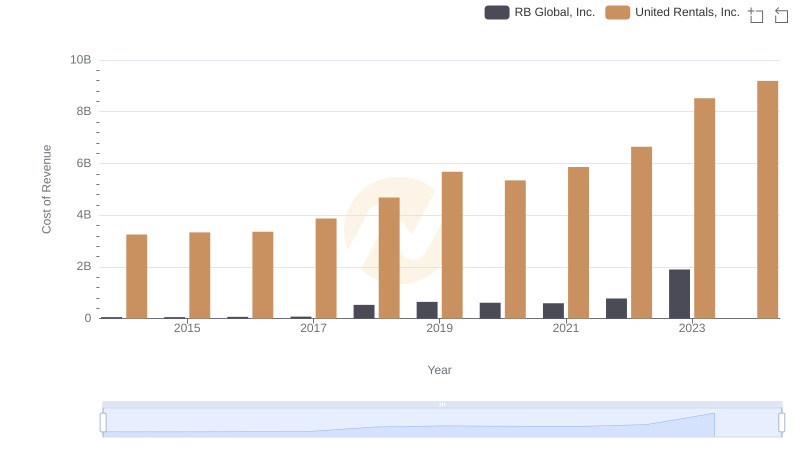
Cost of Revenue Comparison: United Rentals, Inc. vs RB Global, Inc.
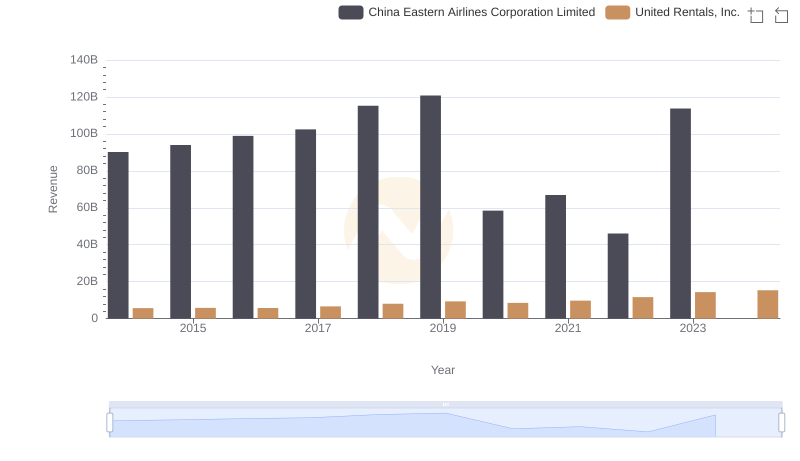
Revenue Insights: United Rentals, Inc. and China Eastern Airlines Corporation Limited Performance Compared
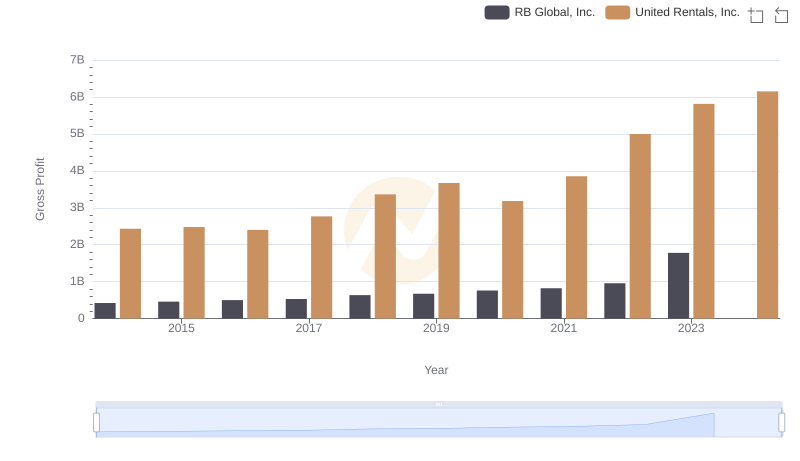
Who Generates Higher Gross Profit? United Rentals, Inc. or RB Global, Inc.
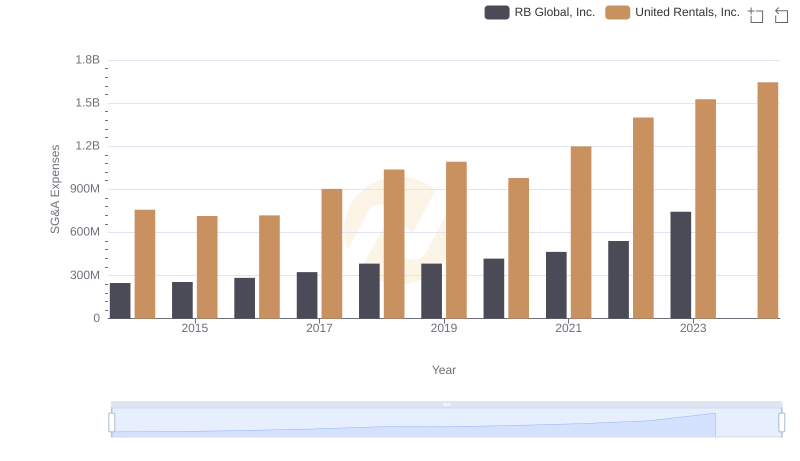
United Rentals, Inc. and RB Global, Inc.: SG&A Spending Patterns Compared
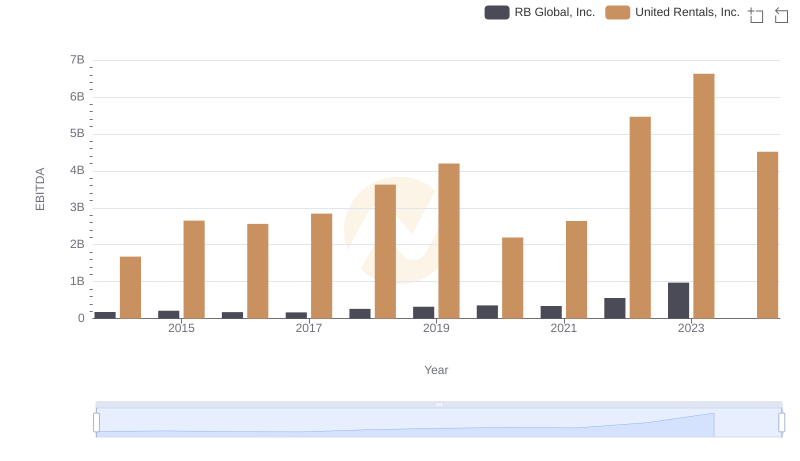
Comprehensive EBITDA Comparison: United Rentals, Inc. vs RB Global, Inc.