| __timestamp | United Rentals, Inc. | XPO Logistics, Inc. |
|---|---|---|
| Wednesday, January 1, 2014 | 3253000000 | 1975000000 |
| Thursday, January 1, 2015 | 3337000000 | 6538400000 |
| Friday, January 1, 2016 | 3359000000 | 12480100000 |
| Sunday, January 1, 2017 | 3872000000 | 13101100000 |
| Monday, January 1, 2018 | 4683000000 | 14738000000 |
| Tuesday, January 1, 2019 | 5681000000 | 13982000000 |
| Wednesday, January 1, 2020 | 5347000000 | 13689000000 |
| Friday, January 1, 2021 | 5863000000 | 10812000000 |
| Saturday, January 1, 2022 | 6646000000 | 6491000000 |
| Sunday, January 1, 2023 | 8519000000 | 6974000000 |
| Monday, January 1, 2024 | 9195000000 | 7157000000 |
Unleashing the power of data
In the ever-evolving landscape of the logistics and rental industries, United Rentals, Inc. and XPO Logistics, Inc. have emerged as key players. Over the past decade, these companies have shown distinct trends in their cost of revenue, reflecting their strategic priorities and market dynamics.
From 2014 to 2023, United Rentals, Inc. has seen a steady increase in its cost of revenue, peaking at approximately 9.2 billion in 2023, a remarkable 182% increase from 2014. This growth underscores the company's expanding operations and market reach. In contrast, XPO Logistics, Inc. experienced a significant rise until 2018, reaching its zenith at around 14.7 billion, before a gradual decline to 6.97 billion in 2023. This fluctuation highlights the company's strategic shifts and market challenges.
These trends offer a fascinating glimpse into the operational strategies of these industry leaders, providing valuable insights for investors and analysts alike.
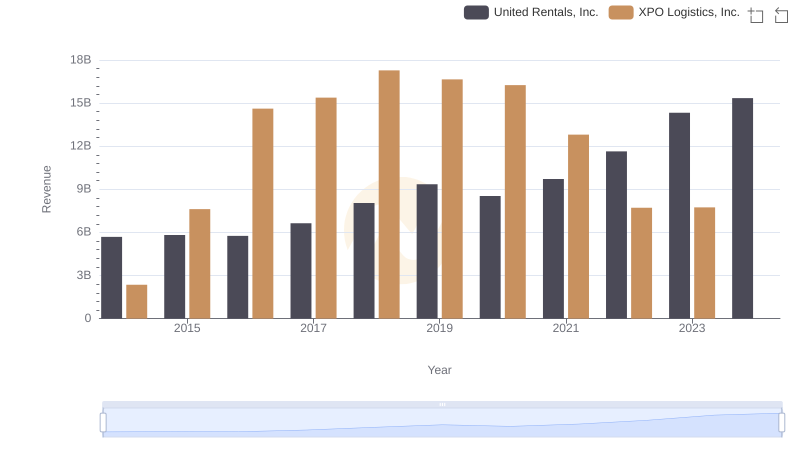
United Rentals, Inc. and XPO Logistics, Inc.: A Comprehensive Revenue Analysis
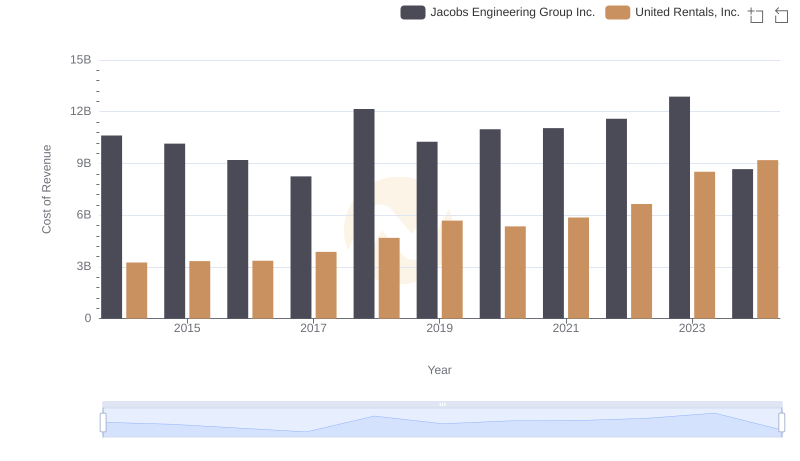
Cost Insights: Breaking Down United Rentals, Inc. and Jacobs Engineering Group Inc.'s Expenses
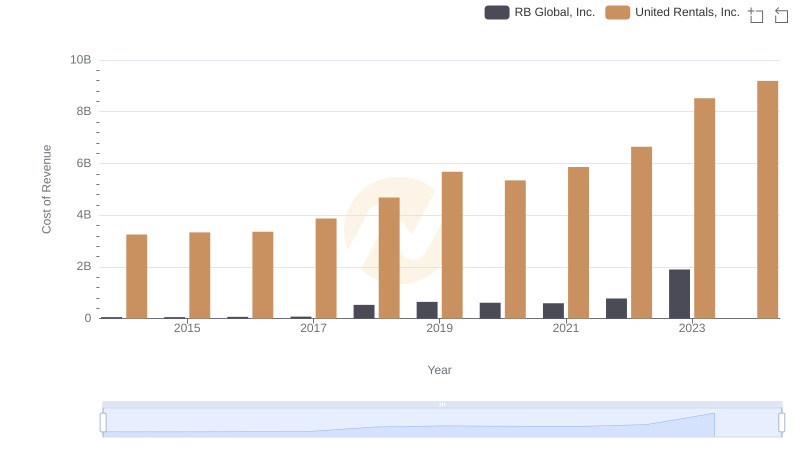
Cost of Revenue Comparison: United Rentals, Inc. vs RB Global, Inc.
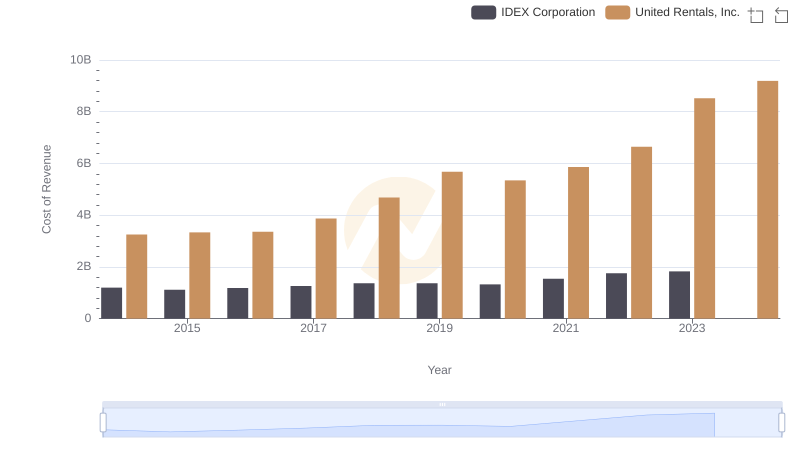
Analyzing Cost of Revenue: United Rentals, Inc. and IDEX Corporation
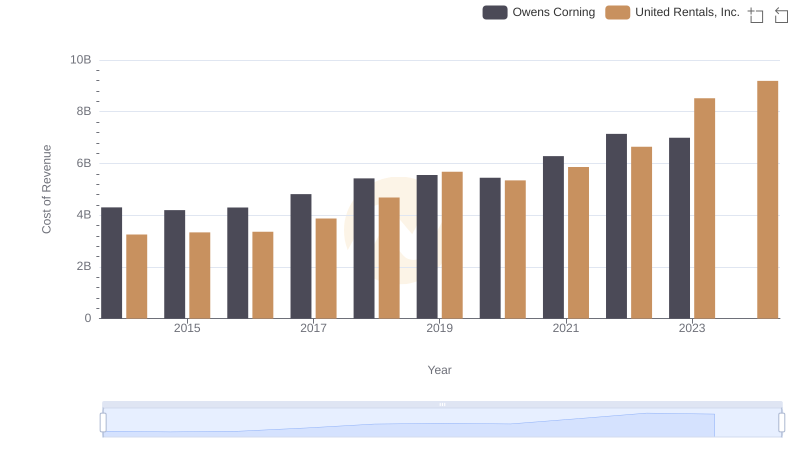
Analyzing Cost of Revenue: United Rentals, Inc. and Owens Corning

Cost of Revenue: Key Insights for United Rentals, Inc. and Expeditors International of Washington, Inc.
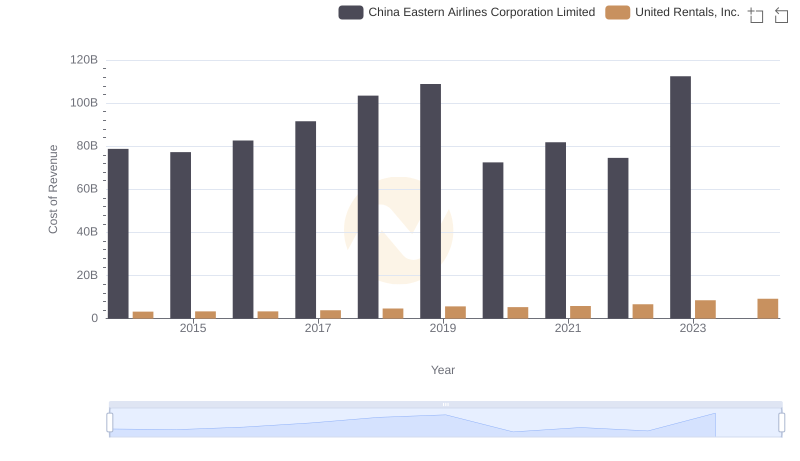
Cost of Revenue: Key Insights for United Rentals, Inc. and China Eastern Airlines Corporation Limited
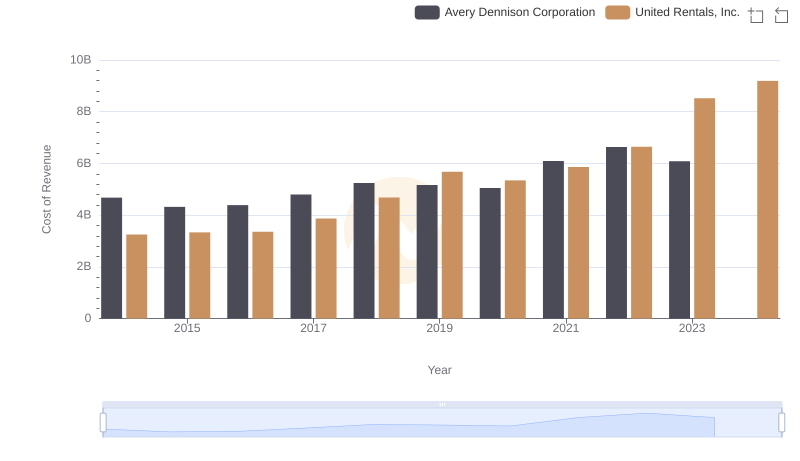
Analyzing Cost of Revenue: United Rentals, Inc. and Avery Dennison Corporation
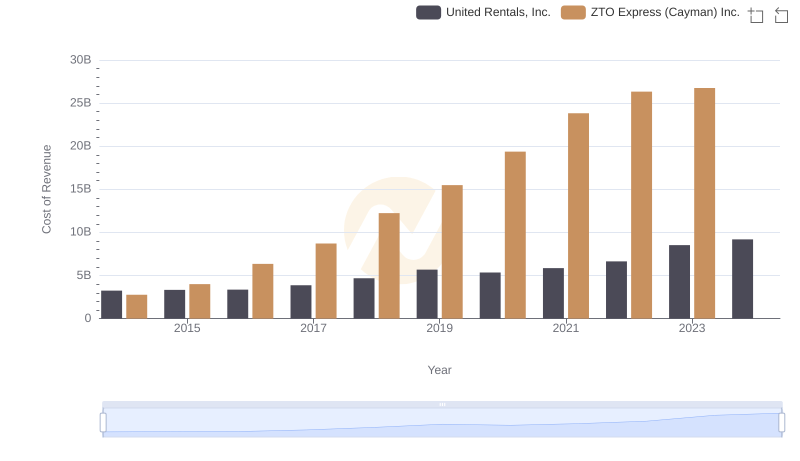
Comparing Cost of Revenue Efficiency: United Rentals, Inc. vs ZTO Express (Cayman) Inc.
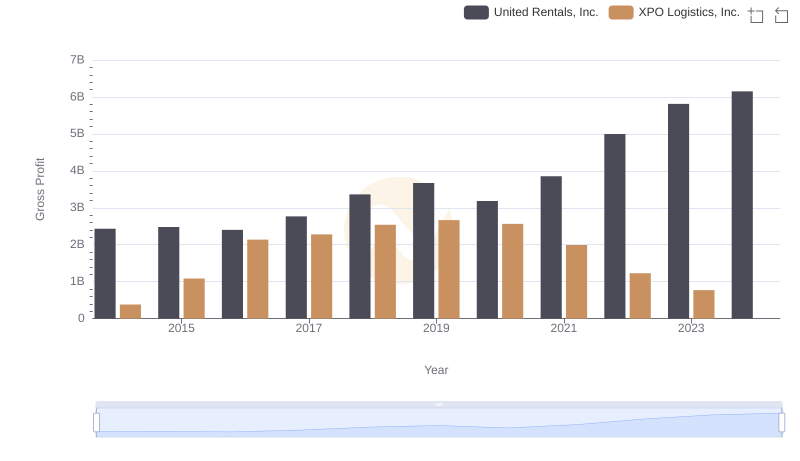
United Rentals, Inc. vs XPO Logistics, Inc.: A Gross Profit Performance Breakdown
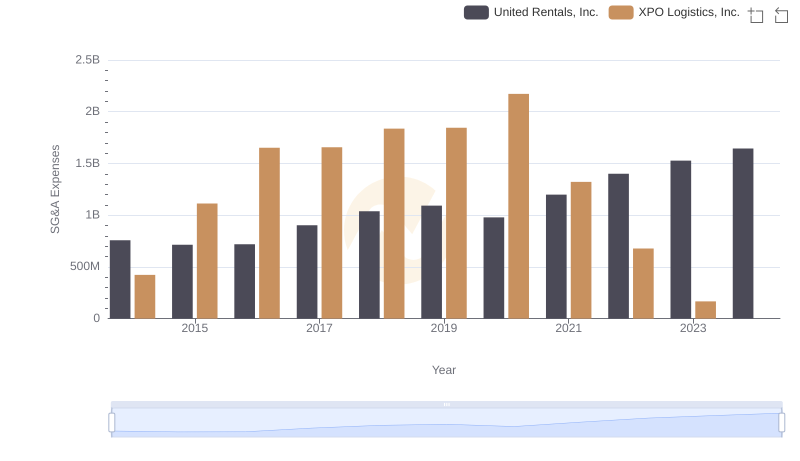
Operational Costs Compared: SG&A Analysis of United Rentals, Inc. and XPO Logistics, Inc.
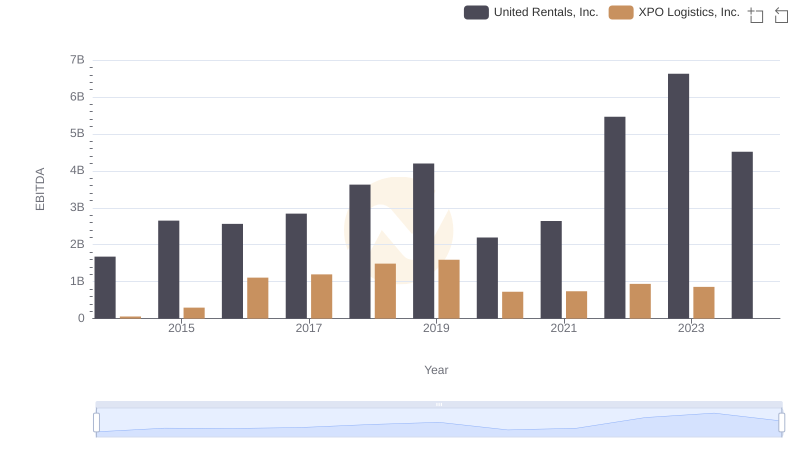
EBITDA Performance Review: United Rentals, Inc. vs XPO Logistics, Inc.