| __timestamp | RB Global, Inc. | United Rentals, Inc. |
|---|---|---|
| Wednesday, January 1, 2014 | 248220000 | 758000000 |
| Thursday, January 1, 2015 | 254990000 | 714000000 |
| Friday, January 1, 2016 | 283529000 | 719000000 |
| Sunday, January 1, 2017 | 323270000 | 903000000 |
| Monday, January 1, 2018 | 382676000 | 1038000000 |
| Tuesday, January 1, 2019 | 382389000 | 1092000000 |
| Wednesday, January 1, 2020 | 417523000 | 979000000 |
| Friday, January 1, 2021 | 464599000 | 1199000000 |
| Saturday, January 1, 2022 | 539933000 | 1400000000 |
| Sunday, January 1, 2023 | 743700000 | 1527000000 |
| Monday, January 1, 2024 | 773900000 | 1645000000 |
In pursuit of knowledge
In the competitive landscape of equipment rental and auction services, understanding spending patterns is crucial. Over the past decade, United Rentals, Inc. and RB Global, Inc. have shown distinct trends in their Selling, General, and Administrative (SG&A) expenses. From 2014 to 2023, United Rentals consistently outspent RB Global, with SG&A expenses peaking at approximately $1.53 billion in 2023, marking a 101% increase from 2014. In contrast, RB Global's SG&A expenses grew by nearly 200% over the same period, reaching around $743 million in 2023. This divergence highlights United Rentals' aggressive expansion strategy, while RB Global's growth reflects a more measured approach. Notably, data for 2024 is incomplete, indicating potential shifts in these trends. As the industry evolves, these spending patterns offer valuable insights into each company's strategic priorities and market positioning.
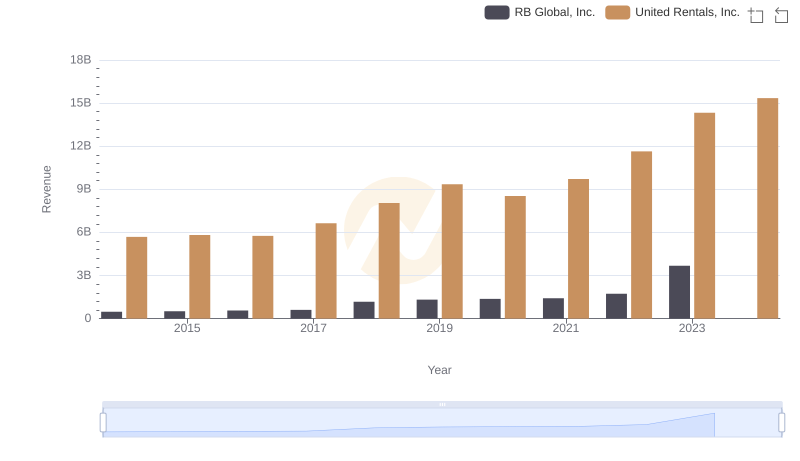
Revenue Insights: United Rentals, Inc. and RB Global, Inc. Performance Compared
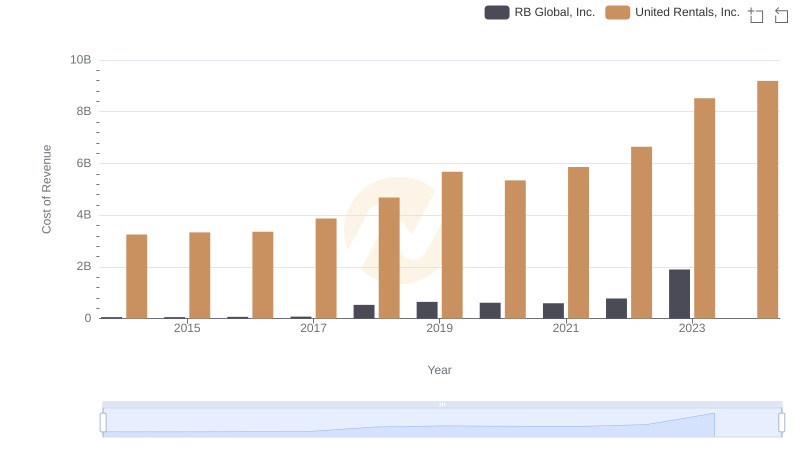
Cost of Revenue Comparison: United Rentals, Inc. vs RB Global, Inc.
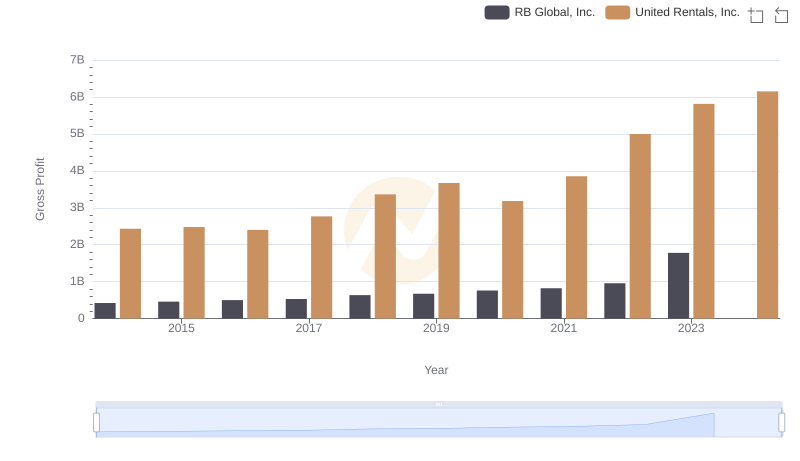
Who Generates Higher Gross Profit? United Rentals, Inc. or RB Global, Inc.
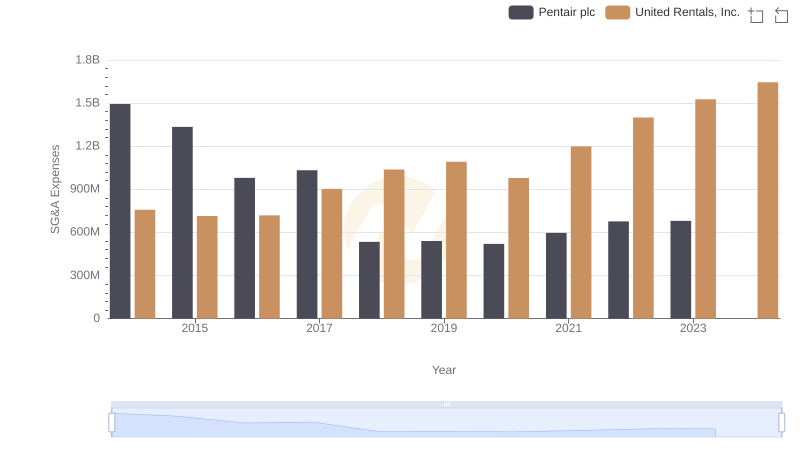
United Rentals, Inc. vs Pentair plc: SG&A Expense Trends
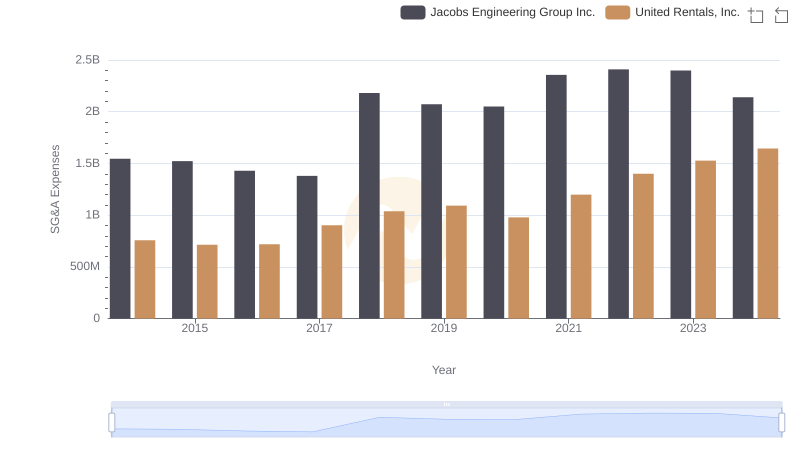
Who Optimizes SG&A Costs Better? United Rentals, Inc. or Jacobs Engineering Group Inc.
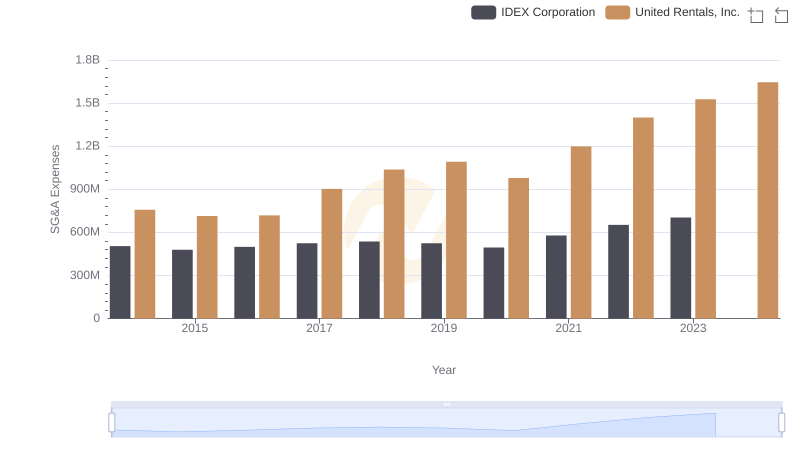
United Rentals, Inc. and IDEX Corporation: SG&A Spending Patterns Compared
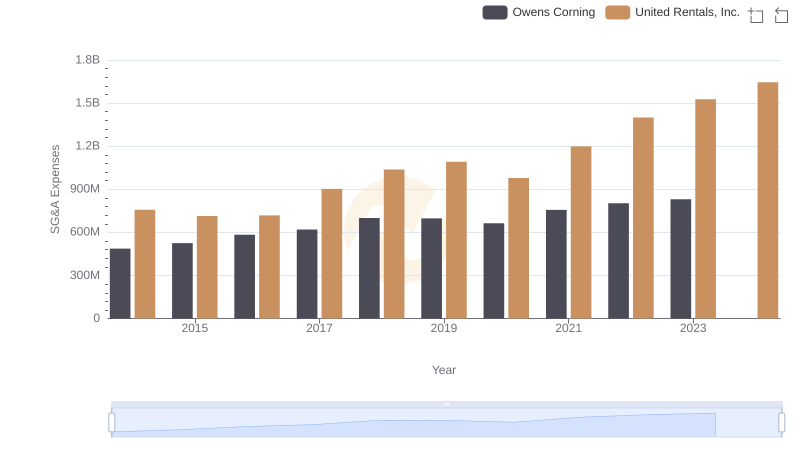
Breaking Down SG&A Expenses: United Rentals, Inc. vs Owens Corning
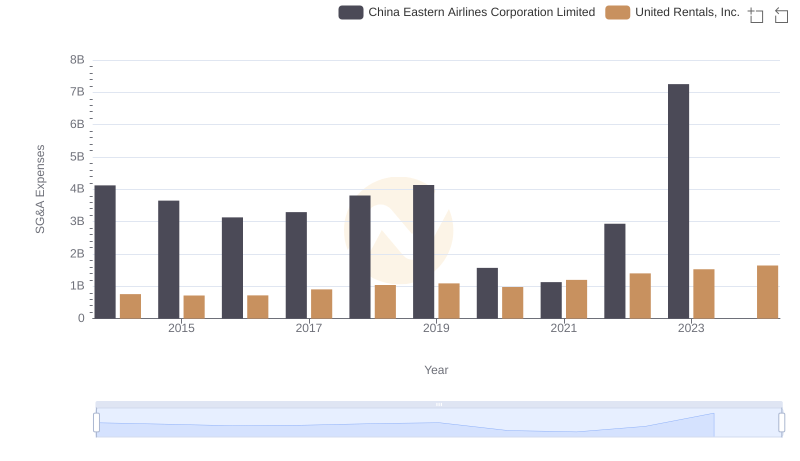
United Rentals, Inc. or China Eastern Airlines Corporation Limited: Who Manages SG&A Costs Better?

Breaking Down SG&A Expenses: United Rentals, Inc. vs Expeditors International of Washington, Inc.
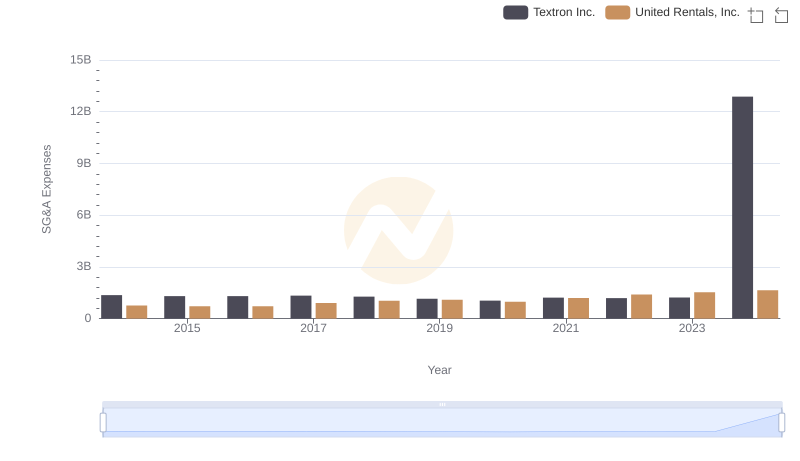
Comparing SG&A Expenses: United Rentals, Inc. vs Textron Inc. Trends and Insights
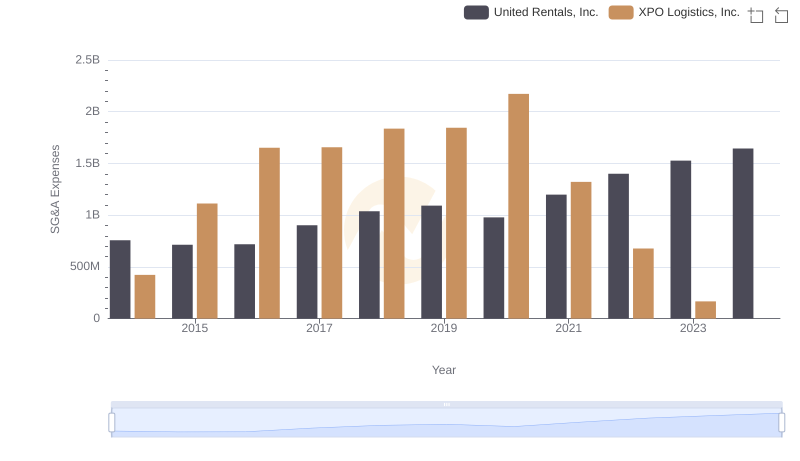
Operational Costs Compared: SG&A Analysis of United Rentals, Inc. and XPO Logistics, Inc.
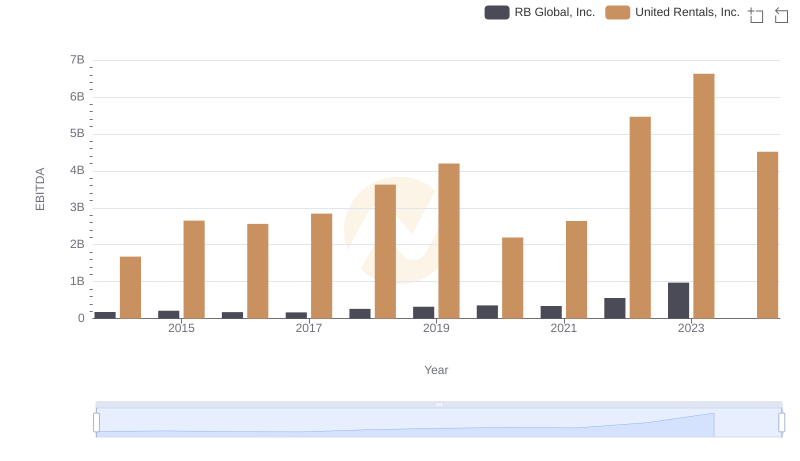
Comprehensive EBITDA Comparison: United Rentals, Inc. vs RB Global, Inc.