| __timestamp | IDEX Corporation | United Rentals, Inc. |
|---|---|---|
| Wednesday, January 1, 2014 | 1198452000 | 3253000000 |
| Thursday, January 1, 2015 | 1116353000 | 3337000000 |
| Friday, January 1, 2016 | 1182276000 | 3359000000 |
| Sunday, January 1, 2017 | 1260634000 | 3872000000 |
| Monday, January 1, 2018 | 1365771000 | 4683000000 |
| Tuesday, January 1, 2019 | 1369539000 | 5681000000 |
| Wednesday, January 1, 2020 | 1324222000 | 5347000000 |
| Friday, January 1, 2021 | 1540300000 | 5863000000 |
| Saturday, January 1, 2022 | 1755000000 | 6646000000 |
| Sunday, January 1, 2023 | 1825400000 | 8519000000 |
| Monday, January 1, 2024 | 1814000000 | 9195000000 |
Data in motion
In the ever-evolving landscape of industrial services, United Rentals, Inc. and IDEX Corporation stand as titans, each with a unique trajectory in cost management. Since 2014, United Rentals has seen its cost of revenue soar by approximately 180%, reflecting its aggressive expansion and market dominance. In contrast, IDEX Corporation has experienced a more modest increase of around 52%, showcasing its steady growth and strategic cost control.
By 2023, United Rentals' cost of revenue reached a staggering 8.5 billion, while IDEX Corporation's figures were more conservative at 1.8 billion. This disparity highlights the contrasting business models and market strategies of these two industry leaders. Notably, the data for 2024 reveals a gap for IDEX, suggesting potential shifts or strategic pivots. As these companies continue to navigate the complexities of the global market, their financial strategies offer valuable insights into the broader industrial sector.
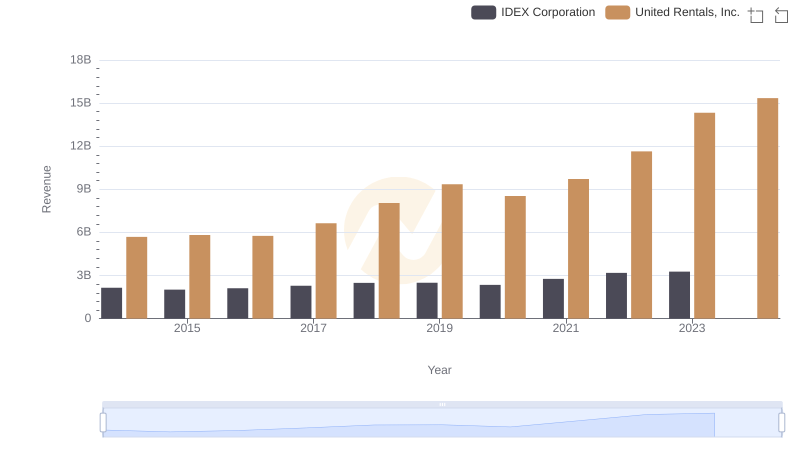
United Rentals, Inc. and IDEX Corporation: A Comprehensive Revenue Analysis
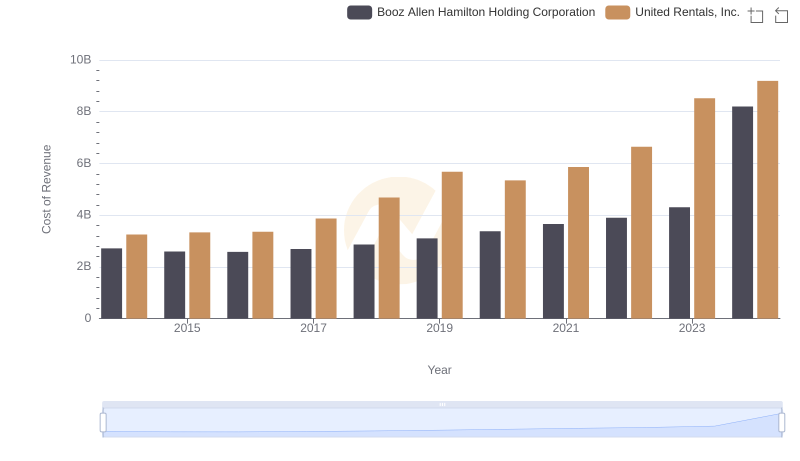
Cost of Revenue: Key Insights for United Rentals, Inc. and Booz Allen Hamilton Holding Corporation
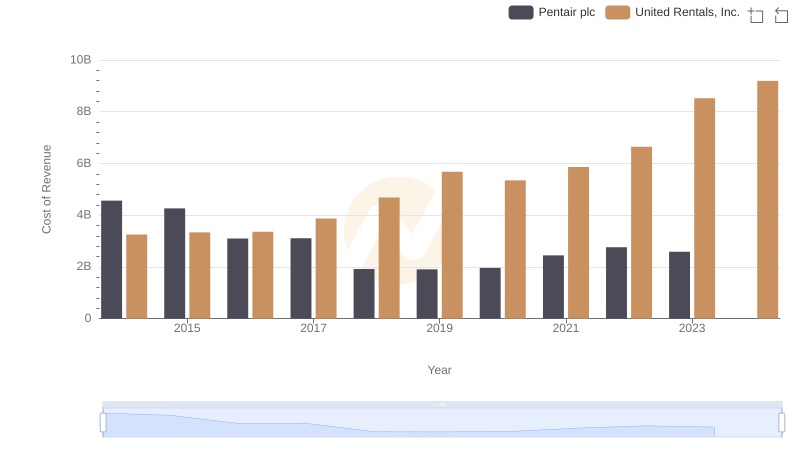
Analyzing Cost of Revenue: United Rentals, Inc. and Pentair plc
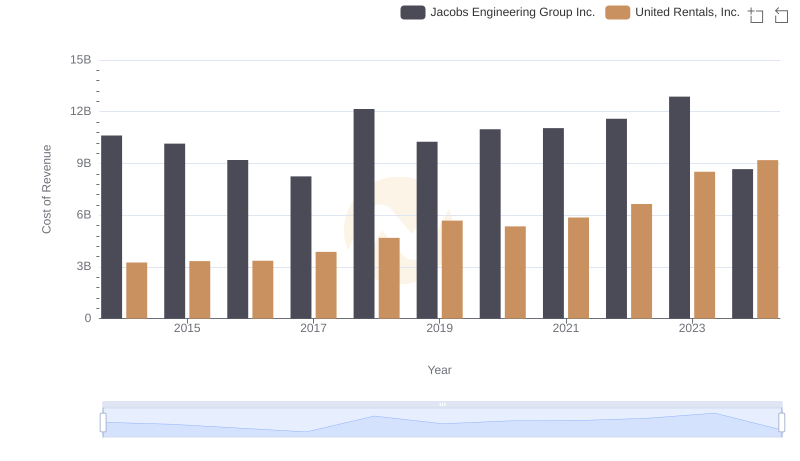
Cost Insights: Breaking Down United Rentals, Inc. and Jacobs Engineering Group Inc.'s Expenses
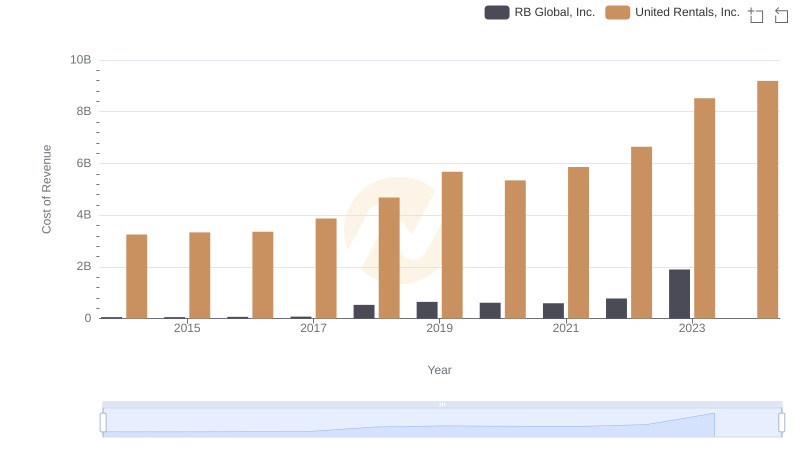
Cost of Revenue Comparison: United Rentals, Inc. vs RB Global, Inc.
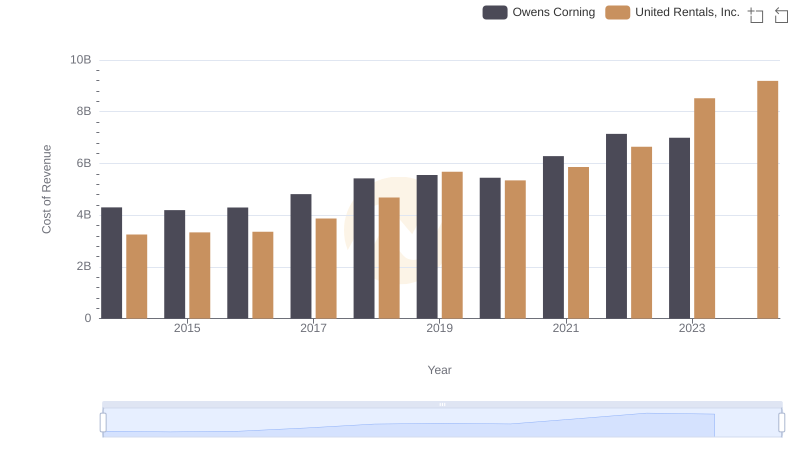
Analyzing Cost of Revenue: United Rentals, Inc. and Owens Corning
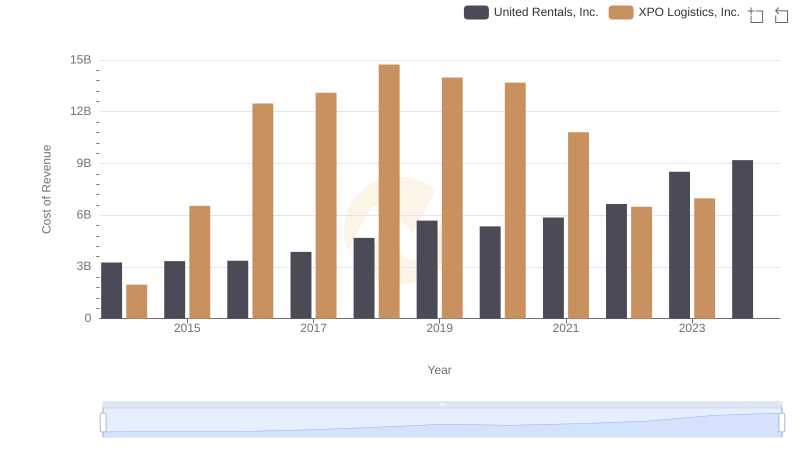
Cost of Revenue Trends: United Rentals, Inc. vs XPO Logistics, Inc.

Cost of Revenue: Key Insights for United Rentals, Inc. and Expeditors International of Washington, Inc.
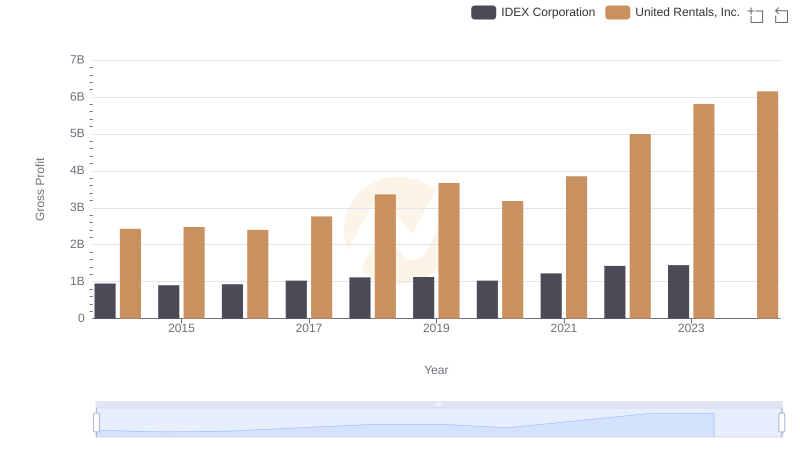
Gross Profit Analysis: Comparing United Rentals, Inc. and IDEX Corporation
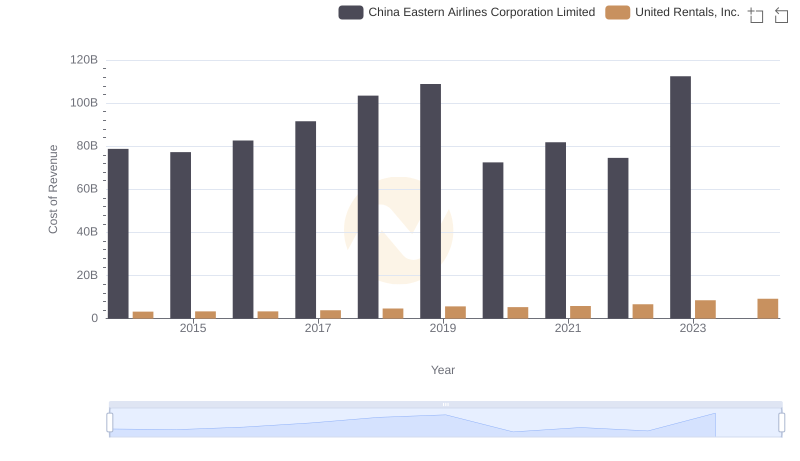
Cost of Revenue: Key Insights for United Rentals, Inc. and China Eastern Airlines Corporation Limited
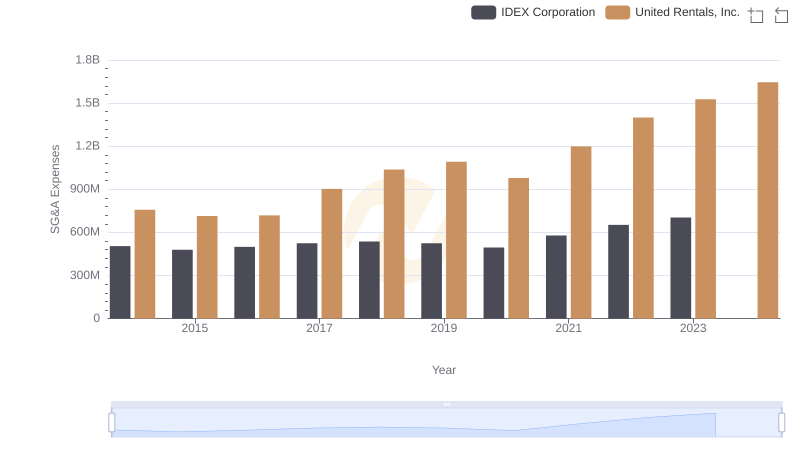
United Rentals, Inc. and IDEX Corporation: SG&A Spending Patterns Compared

Comparative EBITDA Analysis: United Rentals, Inc. vs IDEX Corporation