| __timestamp | Expeditors International of Washington, Inc. | United Rentals, Inc. |
|---|---|---|
| Wednesday, January 1, 2014 | 5800725000 | 3253000000 |
| Thursday, January 1, 2015 | 5720848000 | 3337000000 |
| Friday, January 1, 2016 | 5247244000 | 3359000000 |
| Sunday, January 1, 2017 | 6037921000 | 3872000000 |
| Monday, January 1, 2018 | 7118083000 | 4683000000 |
| Tuesday, January 1, 2019 | 7178405000 | 5681000000 |
| Wednesday, January 1, 2020 | 8953716000 | 5347000000 |
| Friday, January 1, 2021 | 14358105000 | 5863000000 |
| Saturday, January 1, 2022 | 14900154000 | 6646000000 |
| Sunday, January 1, 2023 | 8054634000 | 8519000000 |
| Monday, January 1, 2024 | 0 | 9195000000 |
Unlocking the unknown
In the ever-evolving landscape of logistics and equipment rental, understanding cost dynamics is crucial. Over the past decade, Expeditors International of Washington, Inc. and United Rentals, Inc. have showcased intriguing trends in their cost of revenue. Expeditors International saw a significant rise, peaking in 2022 with a 70% increase from 2014. However, 2023 marked a notable decline, dropping by 46% from the previous year. In contrast, United Rentals demonstrated a steady upward trajectory, with costs rising by approximately 180% from 2014 to 2024. This divergence highlights the distinct operational challenges and strategies within these industries. While Expeditors faced volatility, United Rentals capitalized on consistent growth, reflecting their robust market positioning. Missing data for Expeditors in 2024 suggests potential reporting delays or strategic shifts. These insights underscore the importance of cost management in sustaining competitive advantage.
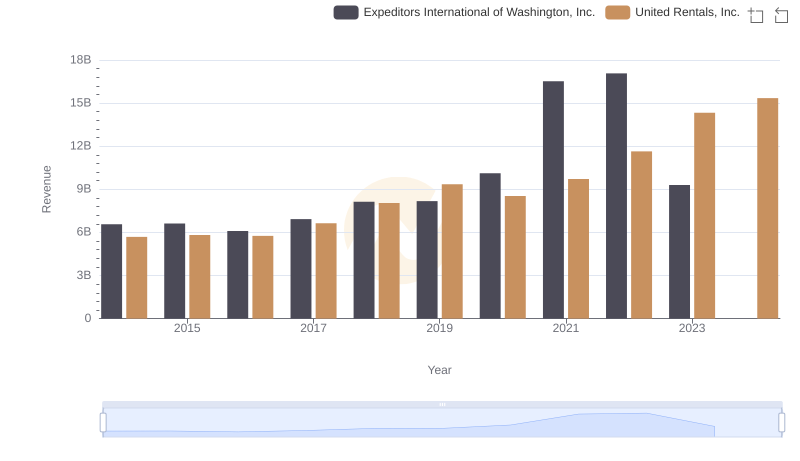
Comparing Revenue Performance: United Rentals, Inc. or Expeditors International of Washington, Inc.?
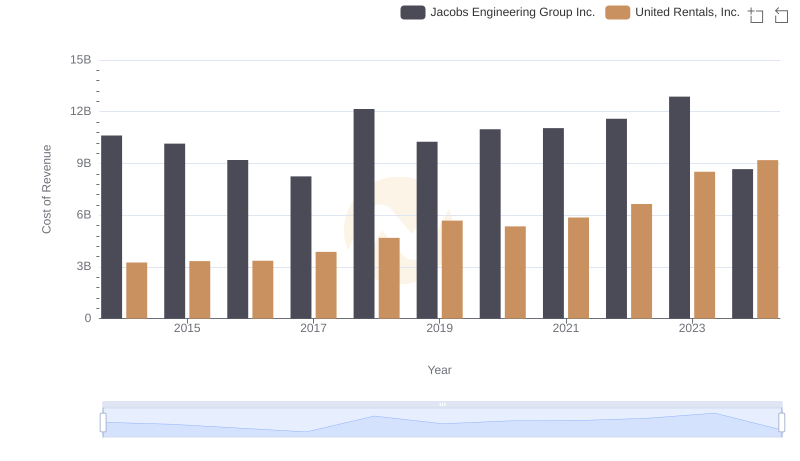
Cost Insights: Breaking Down United Rentals, Inc. and Jacobs Engineering Group Inc.'s Expenses
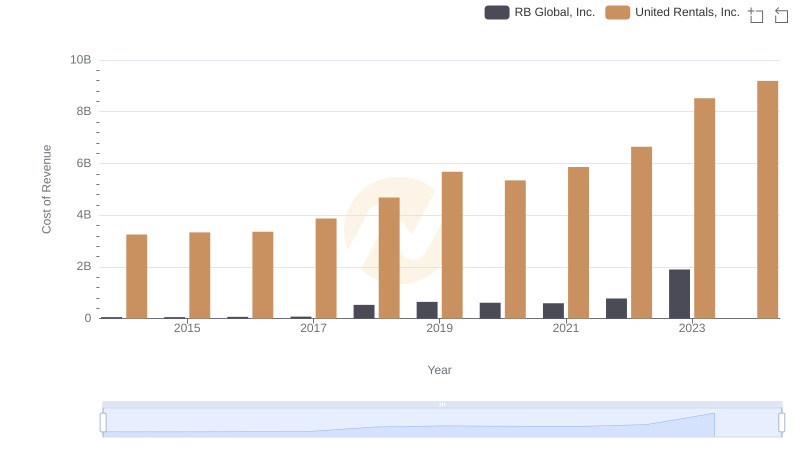
Cost of Revenue Comparison: United Rentals, Inc. vs RB Global, Inc.
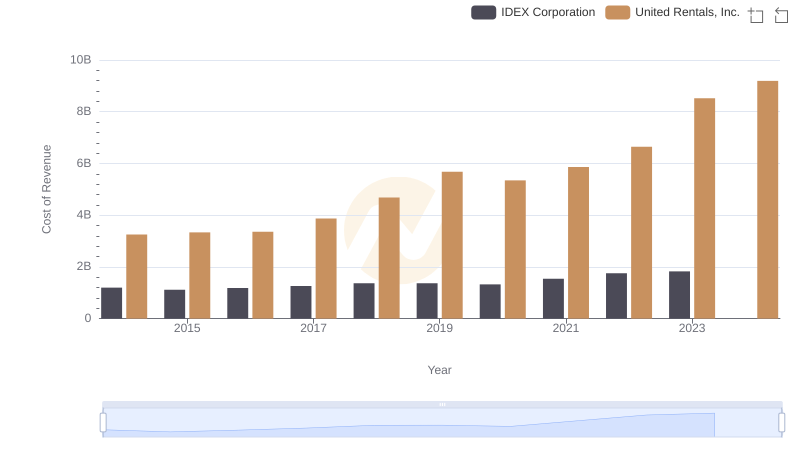
Analyzing Cost of Revenue: United Rentals, Inc. and IDEX Corporation
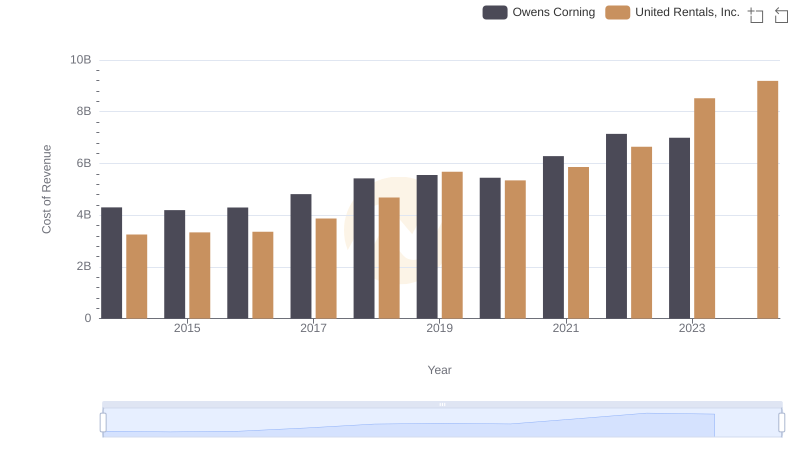
Analyzing Cost of Revenue: United Rentals, Inc. and Owens Corning
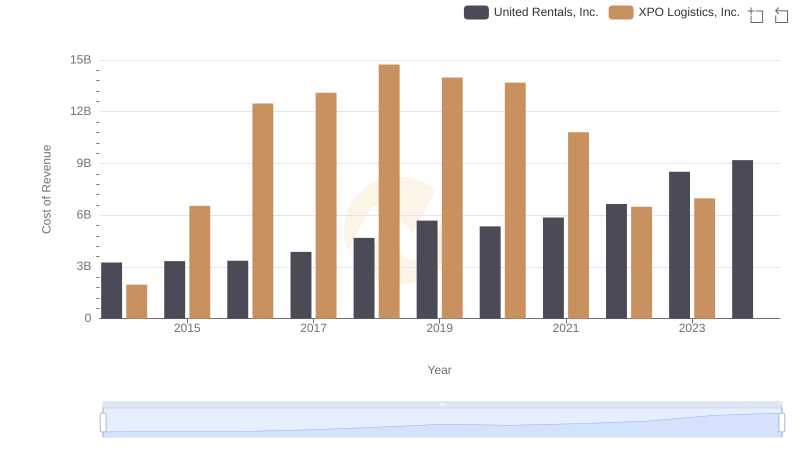
Cost of Revenue Trends: United Rentals, Inc. vs XPO Logistics, Inc.
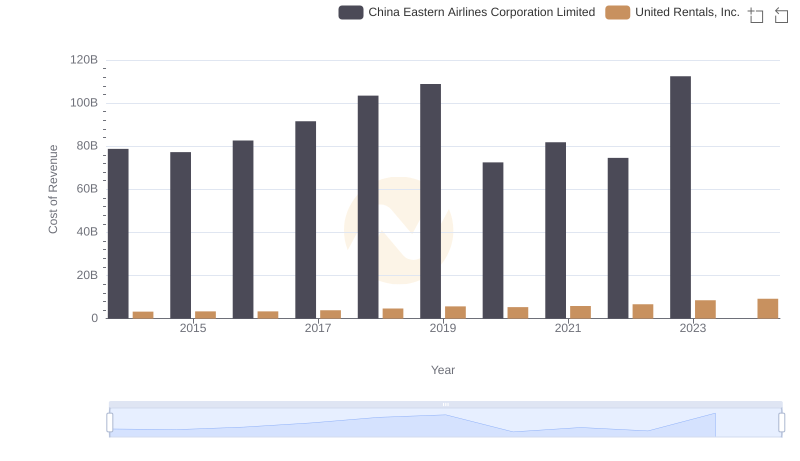
Cost of Revenue: Key Insights for United Rentals, Inc. and China Eastern Airlines Corporation Limited
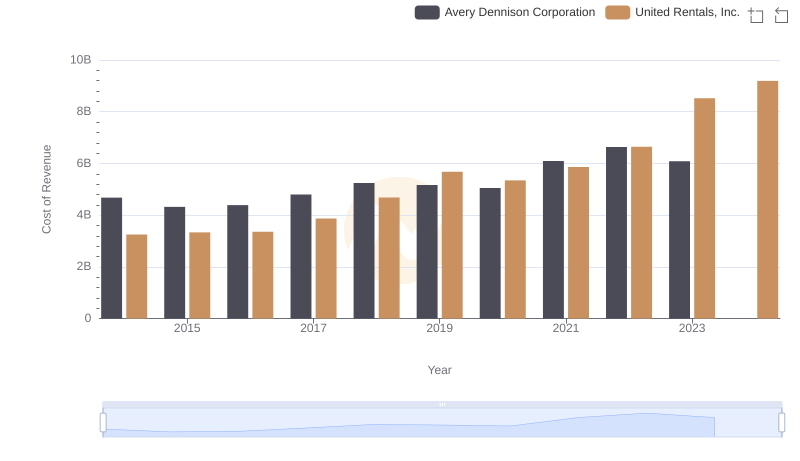
Analyzing Cost of Revenue: United Rentals, Inc. and Avery Dennison Corporation
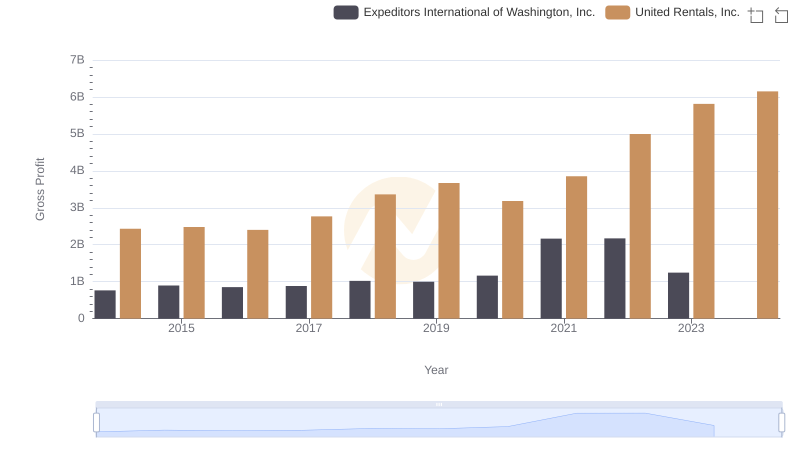
United Rentals, Inc. vs Expeditors International of Washington, Inc.: A Gross Profit Performance Breakdown
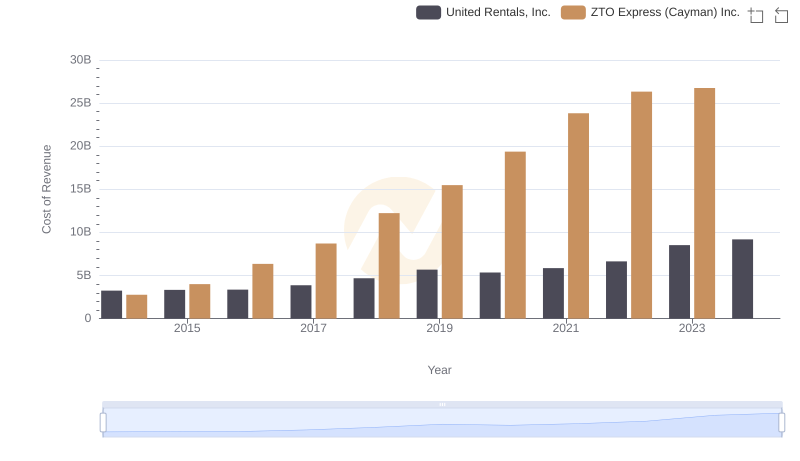
Comparing Cost of Revenue Efficiency: United Rentals, Inc. vs ZTO Express (Cayman) Inc.

Breaking Down SG&A Expenses: United Rentals, Inc. vs Expeditors International of Washington, Inc.
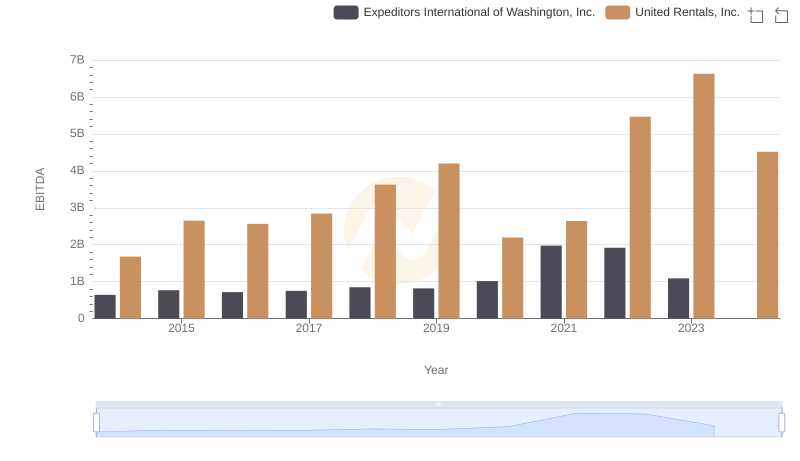
A Side-by-Side Analysis of EBITDA: United Rentals, Inc. and Expeditors International of Washington, Inc.