| __timestamp | China Eastern Airlines Corporation Limited | United Rentals, Inc. |
|---|---|---|
| Wednesday, January 1, 2014 | 78741000000 | 3253000000 |
| Thursday, January 1, 2015 | 77237000000 | 3337000000 |
| Friday, January 1, 2016 | 82676000000 | 3359000000 |
| Sunday, January 1, 2017 | 91592000000 | 3872000000 |
| Monday, January 1, 2018 | 103476000000 | 4683000000 |
| Tuesday, January 1, 2019 | 108865000000 | 5681000000 |
| Wednesday, January 1, 2020 | 72523000000 | 5347000000 |
| Friday, January 1, 2021 | 81828000000 | 5863000000 |
| Saturday, January 1, 2022 | 74599000000 | 6646000000 |
| Sunday, January 1, 2023 | 112461000000 | 8519000000 |
| Monday, January 1, 2024 | 9195000000 |
Infusing magic into the data realm
In the ever-evolving landscape of global business, understanding the cost of revenue is crucial for evaluating a company's financial health. This analysis focuses on United Rentals, Inc. and China Eastern Airlines Corporation Limited, two giants in their respective industries.
From 2014 to 2023, United Rentals, Inc. has shown a steady increase in its cost of revenue, peaking at approximately $8.5 billion in 2023. This represents a growth of over 160% from its 2014 figures, reflecting the company's expanding operations and market reach.
Conversely, China Eastern Airlines experienced fluctuations, with a notable dip in 2020, likely due to the global pandemic. However, by 2023, the cost of revenue soared to an impressive $112 billion, marking a 43% increase from 2014.
This data provides valuable insights into the operational strategies and market dynamics of these industry leaders.
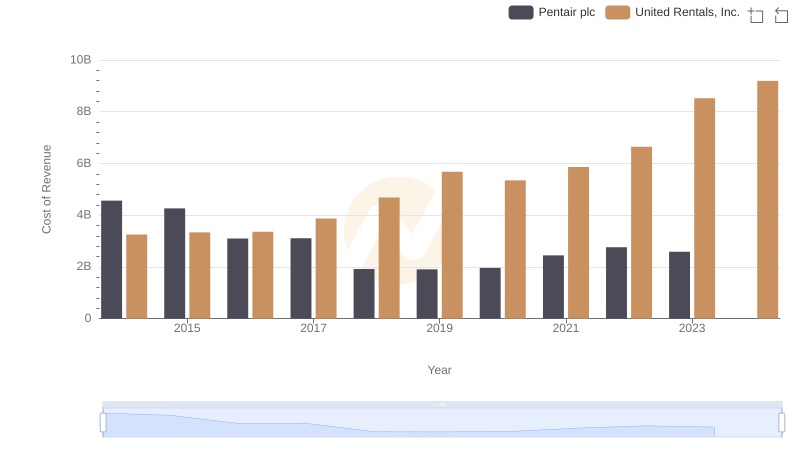
Analyzing Cost of Revenue: United Rentals, Inc. and Pentair plc
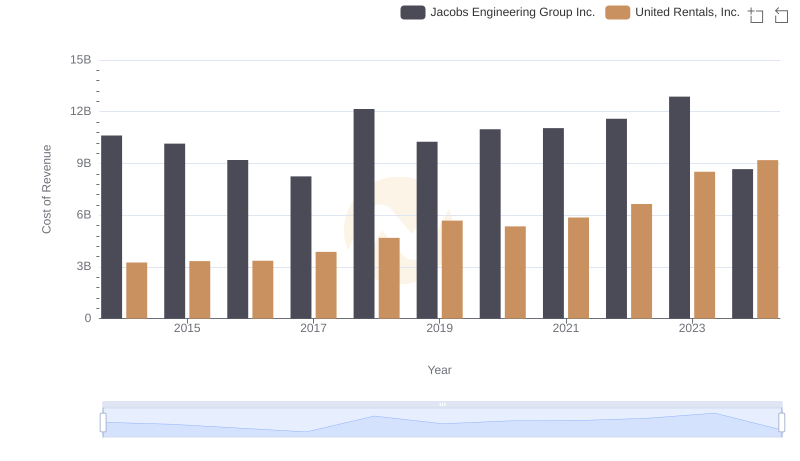
Cost Insights: Breaking Down United Rentals, Inc. and Jacobs Engineering Group Inc.'s Expenses
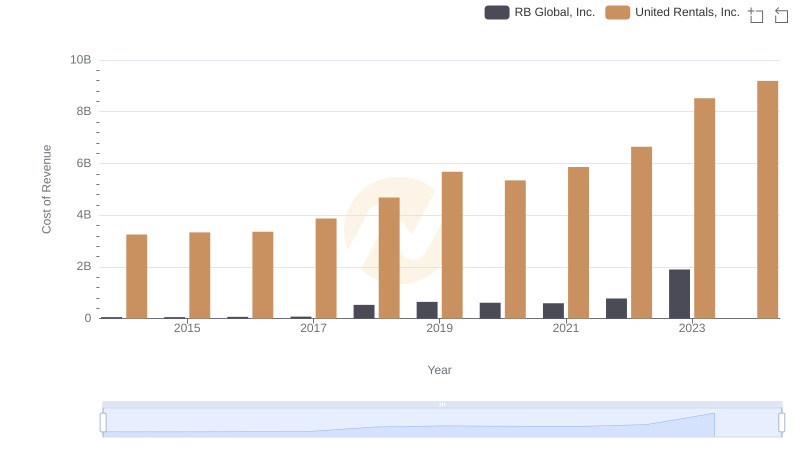
Cost of Revenue Comparison: United Rentals, Inc. vs RB Global, Inc.
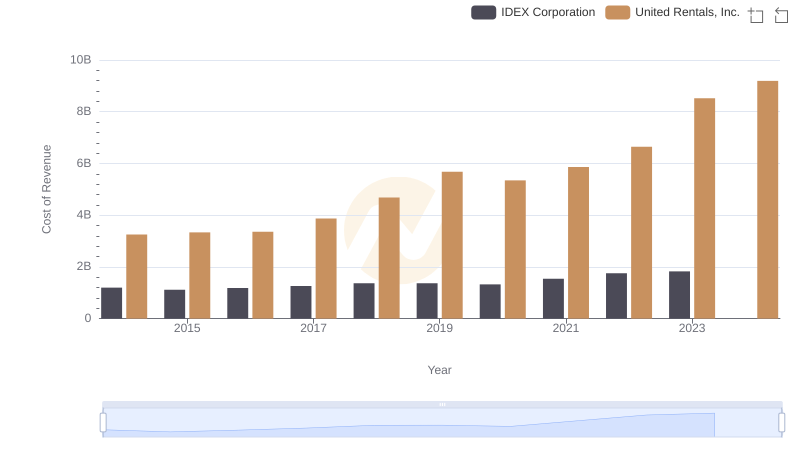
Analyzing Cost of Revenue: United Rentals, Inc. and IDEX Corporation
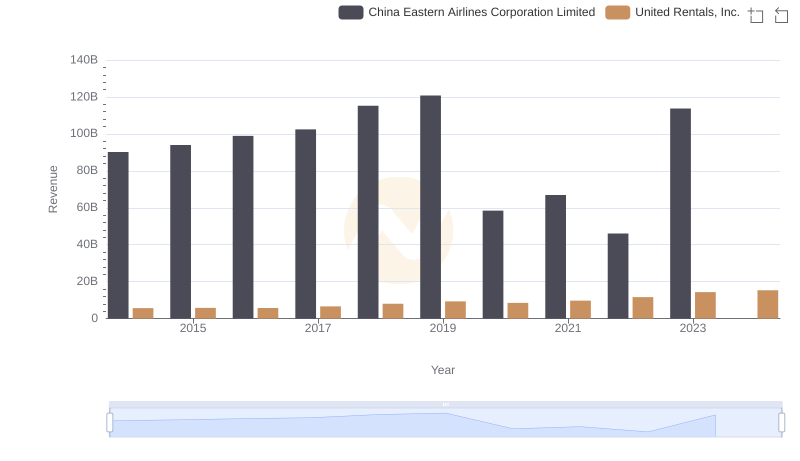
Revenue Insights: United Rentals, Inc. and China Eastern Airlines Corporation Limited Performance Compared
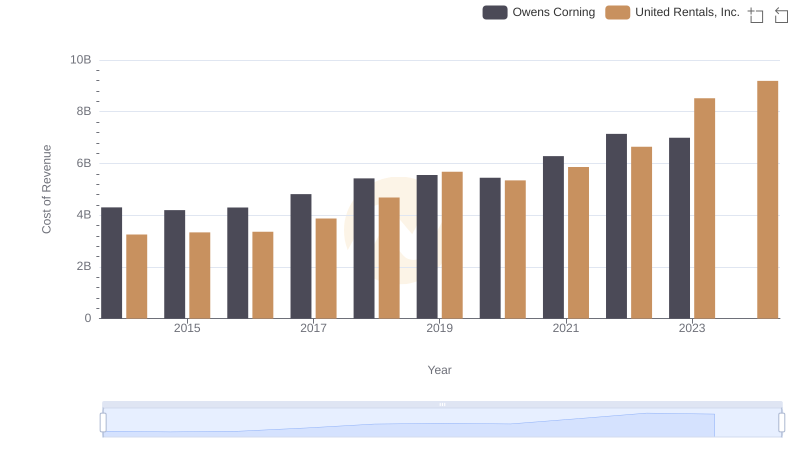
Analyzing Cost of Revenue: United Rentals, Inc. and Owens Corning
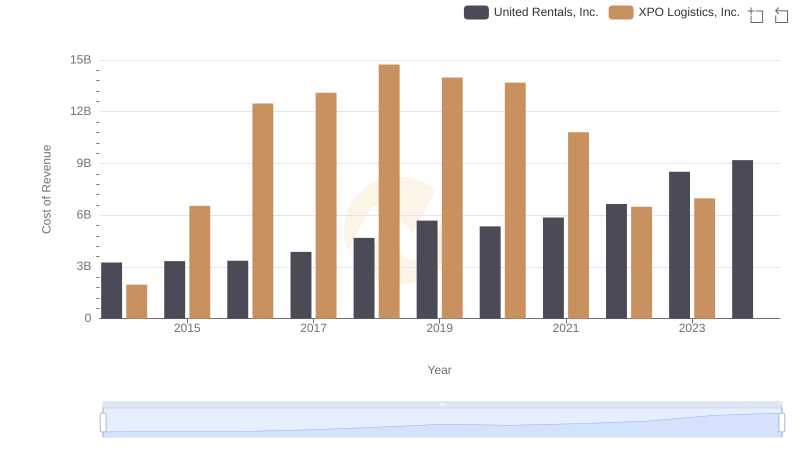
Cost of Revenue Trends: United Rentals, Inc. vs XPO Logistics, Inc.

Cost of Revenue: Key Insights for United Rentals, Inc. and Expeditors International of Washington, Inc.
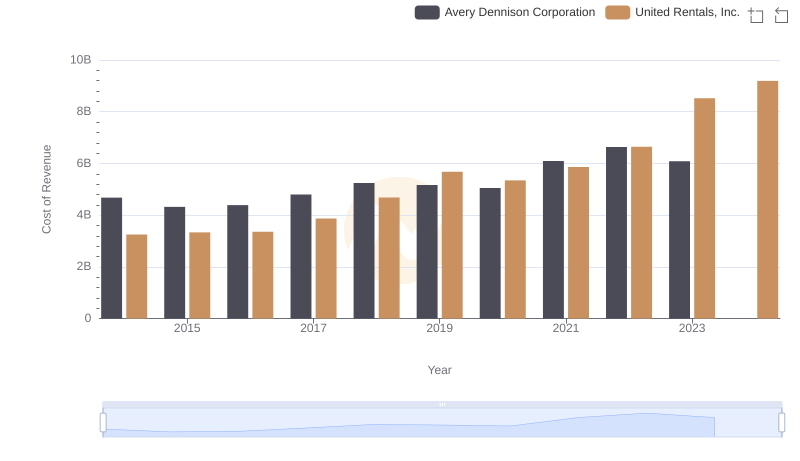
Analyzing Cost of Revenue: United Rentals, Inc. and Avery Dennison Corporation
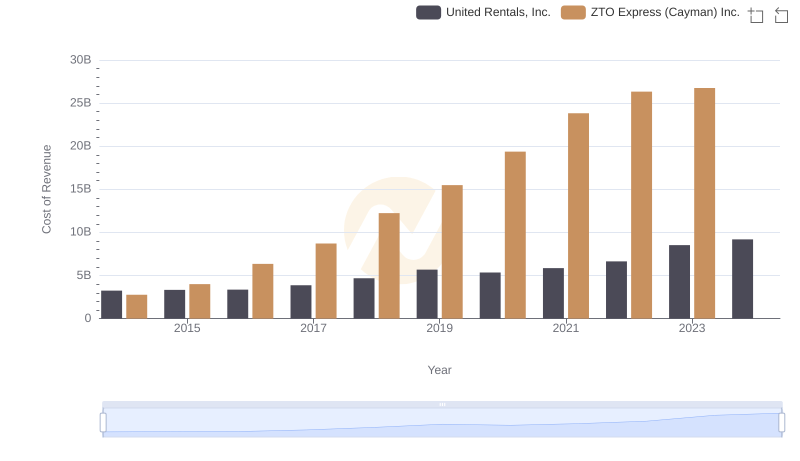
Comparing Cost of Revenue Efficiency: United Rentals, Inc. vs ZTO Express (Cayman) Inc.
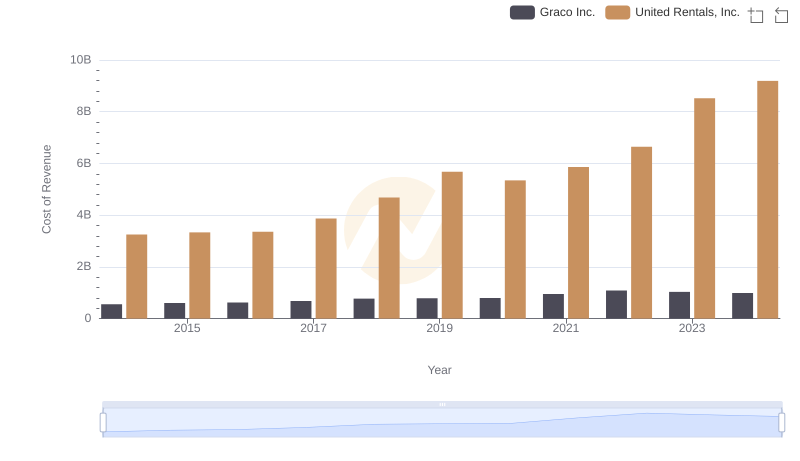
Analyzing Cost of Revenue: United Rentals, Inc. and Graco Inc.
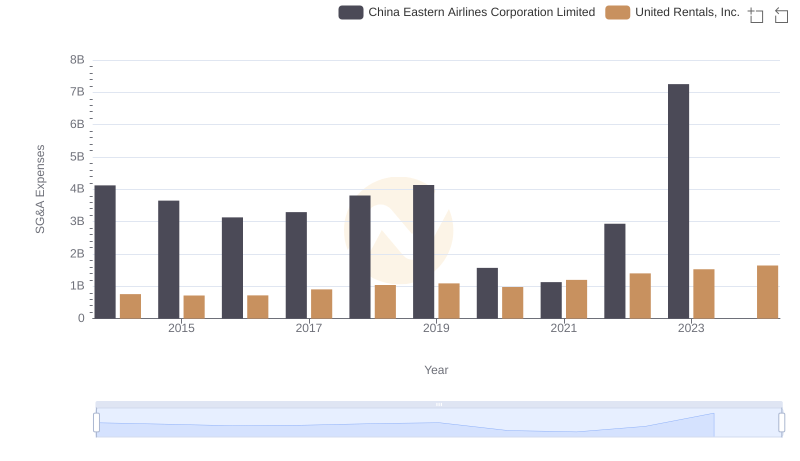
United Rentals, Inc. or China Eastern Airlines Corporation Limited: Who Manages SG&A Costs Better?