| __timestamp | Owens Corning | United Rentals, Inc. |
|---|---|---|
| Wednesday, January 1, 2014 | 4300000000 | 3253000000 |
| Thursday, January 1, 2015 | 4197000000 | 3337000000 |
| Friday, January 1, 2016 | 4296000000 | 3359000000 |
| Sunday, January 1, 2017 | 4812000000 | 3872000000 |
| Monday, January 1, 2018 | 5425000000 | 4683000000 |
| Tuesday, January 1, 2019 | 5551000000 | 5681000000 |
| Wednesday, January 1, 2020 | 5445000000 | 5347000000 |
| Friday, January 1, 2021 | 6281000000 | 5863000000 |
| Saturday, January 1, 2022 | 7145000000 | 6646000000 |
| Sunday, January 1, 2023 | 6994000000 | 8519000000 |
| Monday, January 1, 2024 | 9195000000 |
Cracking the code
In the ever-evolving landscape of industrial services and materials, United Rentals, Inc. and Owens Corning stand as titans. Over the past decade, these companies have demonstrated remarkable growth in their cost of revenue, a key indicator of operational scale and efficiency. From 2014 to 2023, Owens Corning's cost of revenue surged by approximately 63%, peaking in 2022. Meanwhile, United Rentals, Inc. exhibited an even more impressive trajectory, with a 162% increase, reaching its zenith in 2024.
Owens Corning's cost of revenue consistently climbed, reflecting its expanding market presence and operational investments. However, the data for 2024 remains elusive, leaving room for speculation on future trends. On the other hand, United Rentals, Inc. not only surpassed Owens Corning in 2023 but also continued its upward momentum into 2024, showcasing its robust growth strategy.
As these industry leaders forge ahead, stakeholders and investors keenly observe their strategies to manage costs while driving growth. The missing data for Owens Corning in 2024 adds an element of intrigue, prompting questions about its future trajectory.
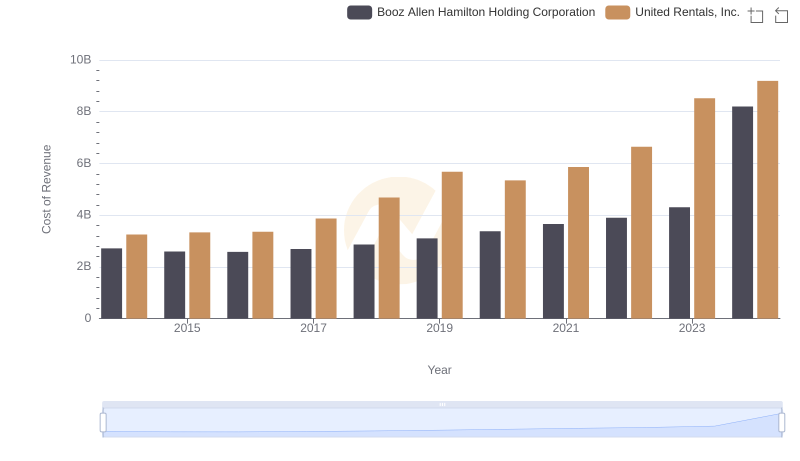
Cost of Revenue: Key Insights for United Rentals, Inc. and Booz Allen Hamilton Holding Corporation
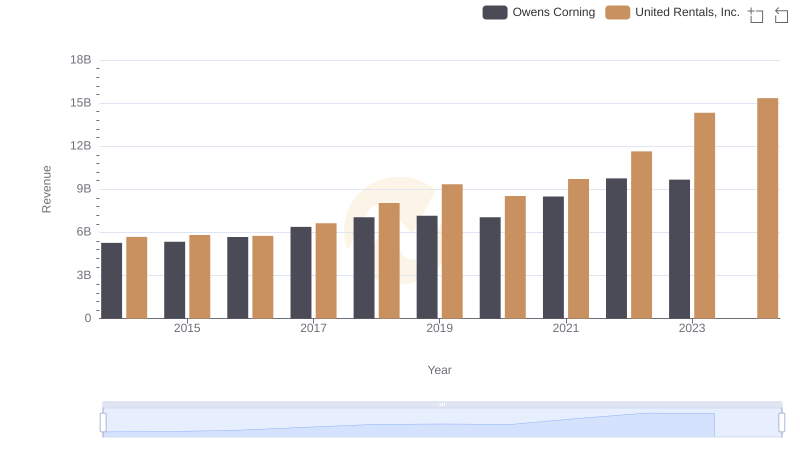
United Rentals, Inc. vs Owens Corning: Annual Revenue Growth Compared
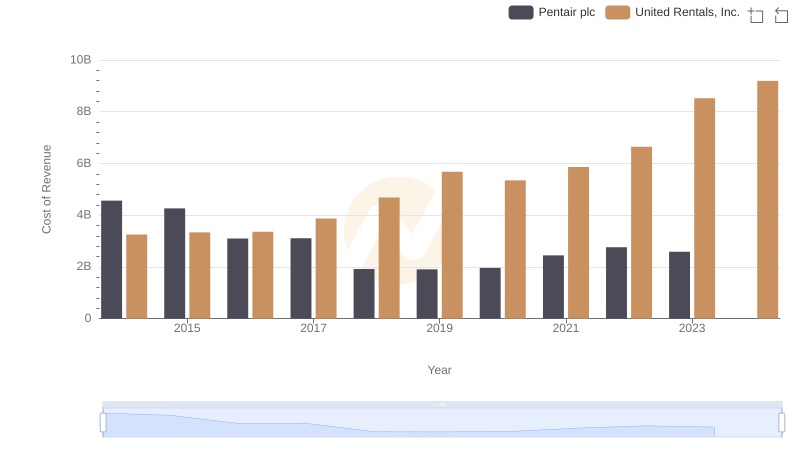
Analyzing Cost of Revenue: United Rentals, Inc. and Pentair plc
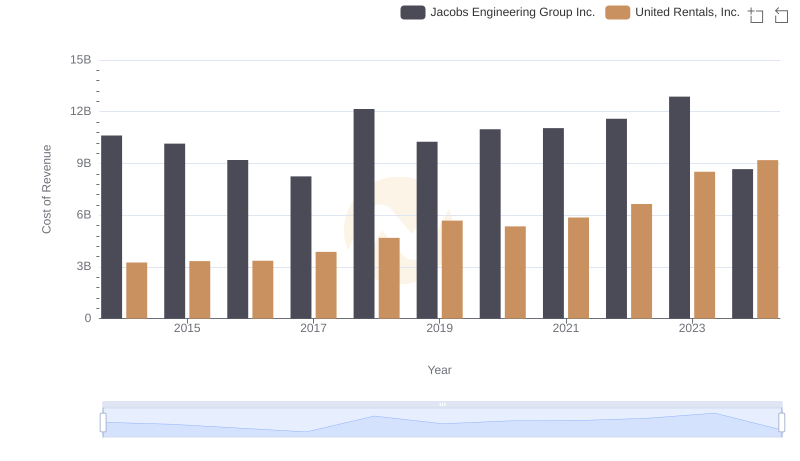
Cost Insights: Breaking Down United Rentals, Inc. and Jacobs Engineering Group Inc.'s Expenses
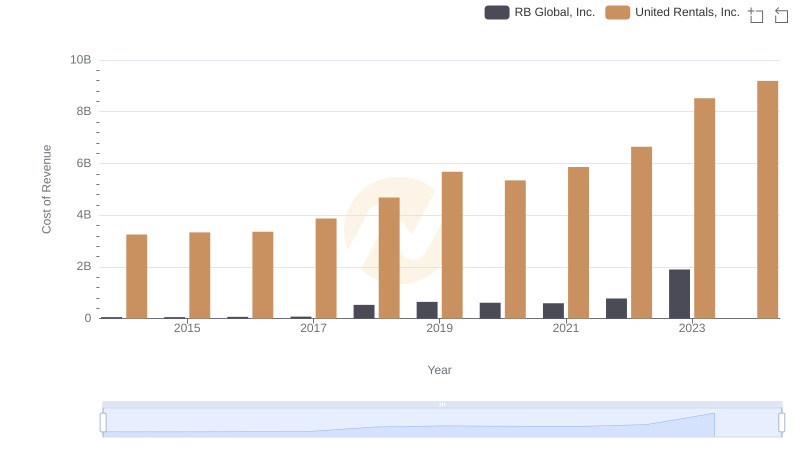
Cost of Revenue Comparison: United Rentals, Inc. vs RB Global, Inc.
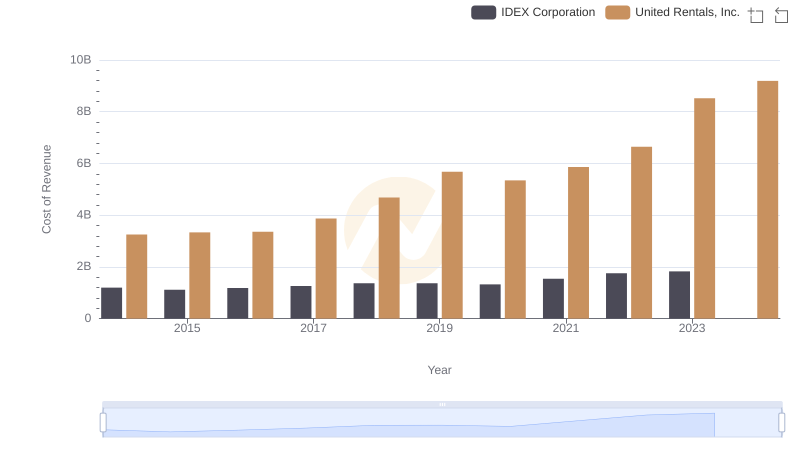
Analyzing Cost of Revenue: United Rentals, Inc. and IDEX Corporation
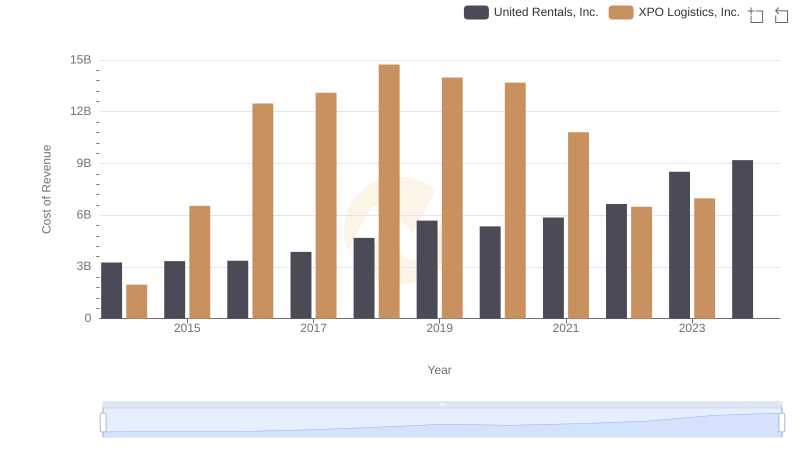
Cost of Revenue Trends: United Rentals, Inc. vs XPO Logistics, Inc.

Cost of Revenue: Key Insights for United Rentals, Inc. and Expeditors International of Washington, Inc.
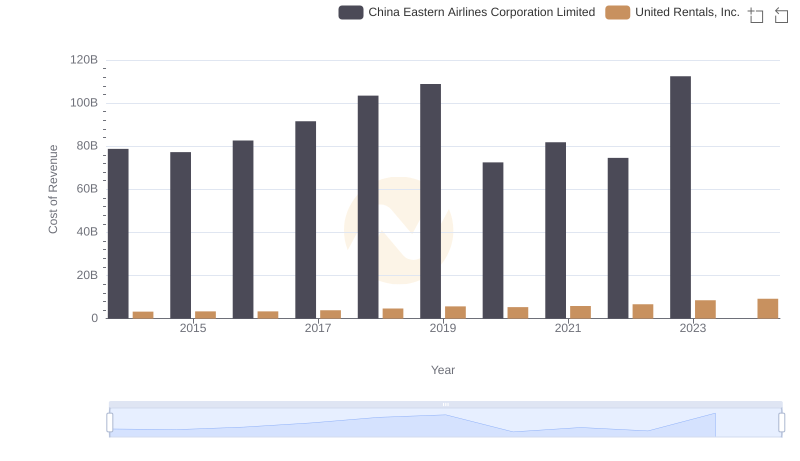
Cost of Revenue: Key Insights for United Rentals, Inc. and China Eastern Airlines Corporation Limited
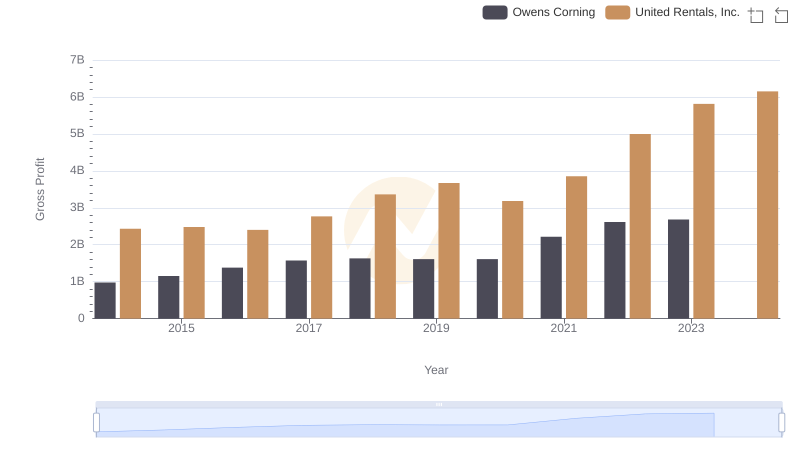
United Rentals, Inc. and Owens Corning: A Detailed Gross Profit Analysis
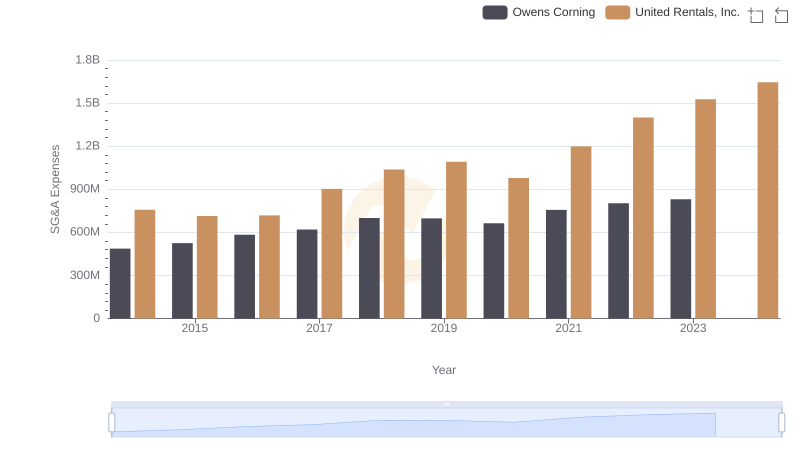
Breaking Down SG&A Expenses: United Rentals, Inc. vs Owens Corning

United Rentals, Inc. vs Owens Corning: In-Depth EBITDA Performance Comparison