| __timestamp | J.B. Hunt Transport Services, Inc. | United Rentals, Inc. |
|---|---|---|
| Wednesday, January 1, 2014 | 1041346000 | 2432000000 |
| Thursday, January 1, 2015 | 1146174000 | 2480000000 |
| Friday, January 1, 2016 | 1185633000 | 2403000000 |
| Sunday, January 1, 2017 | 1199293000 | 2769000000 |
| Monday, January 1, 2018 | 1359217000 | 3364000000 |
| Tuesday, January 1, 2019 | 1506255000 | 3670000000 |
| Wednesday, January 1, 2020 | 1449876000 | 3183000000 |
| Friday, January 1, 2021 | 1869819000 | 3853000000 |
| Saturday, January 1, 2022 | 2472527000 | 4996000000 |
| Sunday, January 1, 2023 | 2396388000 | 5813000000 |
| Monday, January 1, 2024 | 6150000000 |
Infusing magic into the data realm
In the competitive landscape of American industry, United Rentals, Inc. and J.B. Hunt Transport Services, Inc. have emerged as titans in their respective fields. Over the past decade, United Rentals has consistently outperformed J.B. Hunt in terms of gross profit, showcasing a robust growth trajectory. From 2014 to 2023, United Rentals' gross profit surged by approximately 139%, peaking at an impressive $5.8 billion in 2023. In contrast, J.B. Hunt's growth, while steady, was more modest, with a 130% increase, reaching $2.4 billion in 2023. This trend highlights United Rentals' strategic prowess in capitalizing on market opportunities. However, the data for 2024 is incomplete, leaving room for speculation on future dynamics. As these industry leaders continue to evolve, their financial narratives offer valuable insights into the broader economic landscape.
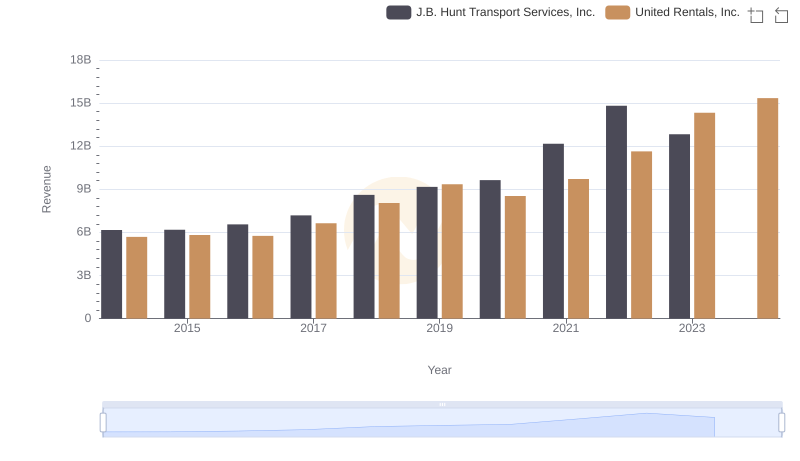
United Rentals, Inc. vs J.B. Hunt Transport Services, Inc.: Examining Key Revenue Metrics
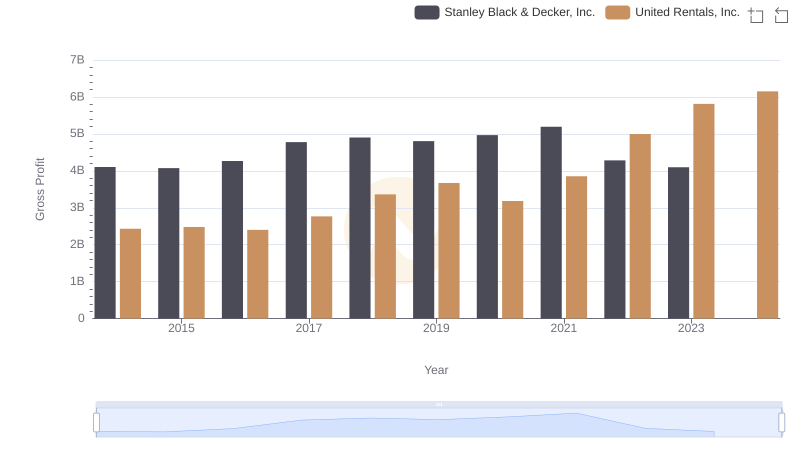
Gross Profit Analysis: Comparing United Rentals, Inc. and Stanley Black & Decker, Inc.
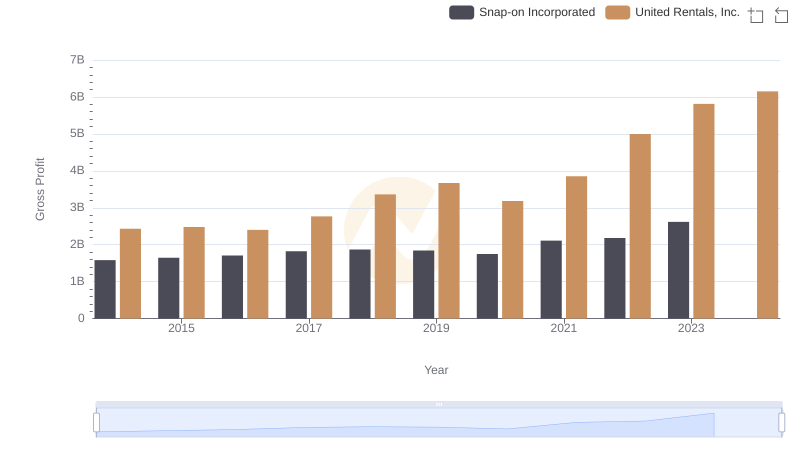
Gross Profit Analysis: Comparing United Rentals, Inc. and Snap-on Incorporated
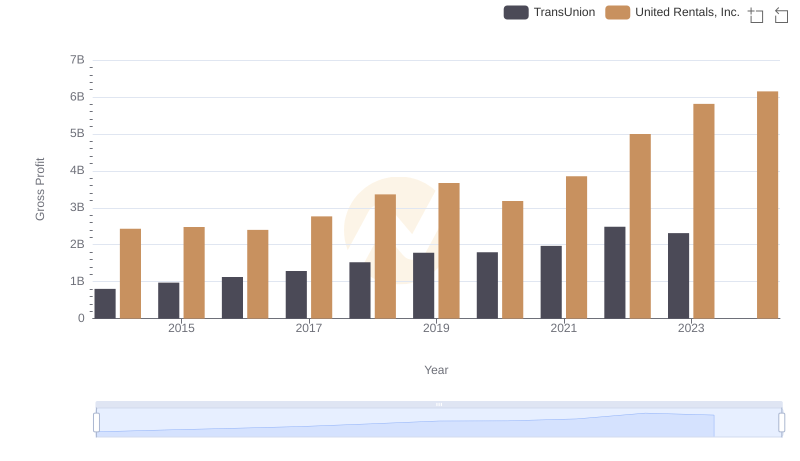
United Rentals, Inc. and TransUnion: A Detailed Gross Profit Analysis
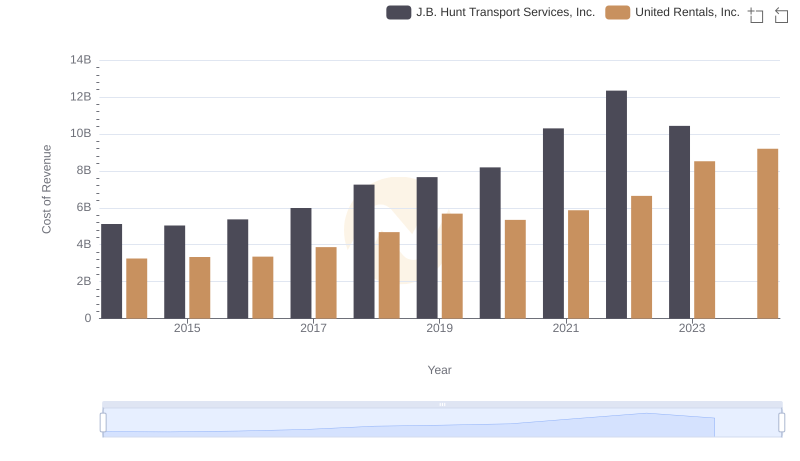
Cost of Revenue Comparison: United Rentals, Inc. vs J.B. Hunt Transport Services, Inc.
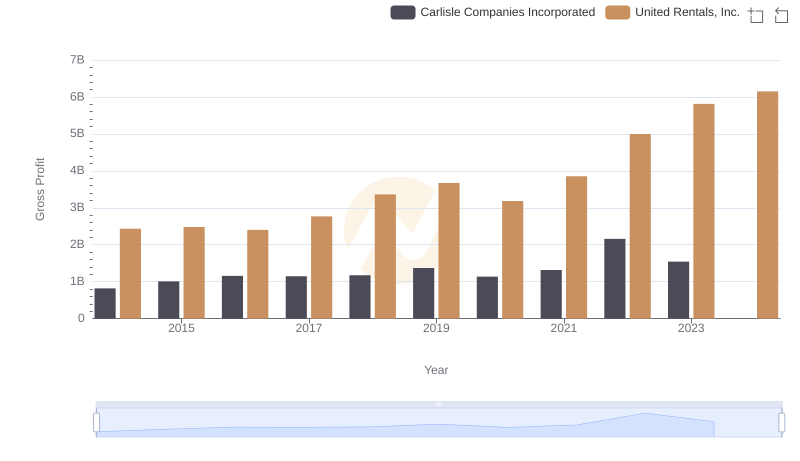
Gross Profit Comparison: United Rentals, Inc. and Carlisle Companies Incorporated Trends
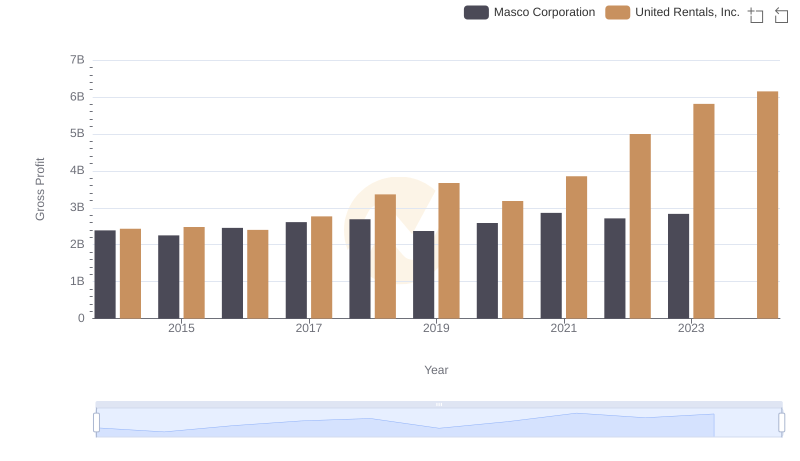
United Rentals, Inc. vs Masco Corporation: A Gross Profit Performance Breakdown
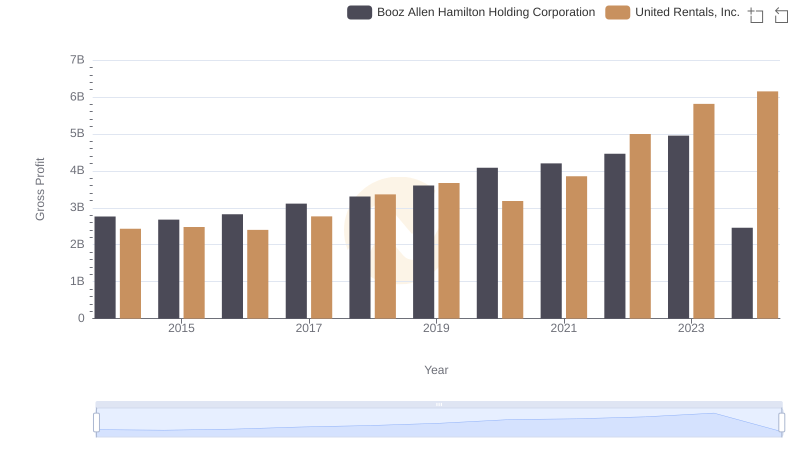
Gross Profit Comparison: United Rentals, Inc. and Booz Allen Hamilton Holding Corporation Trends
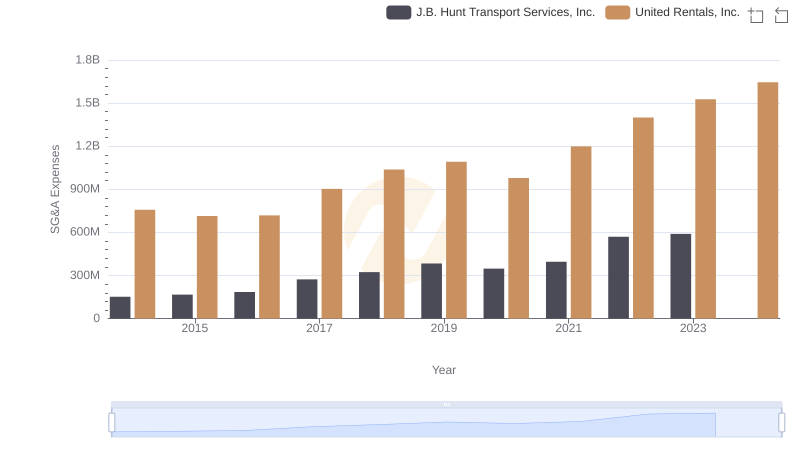
Breaking Down SG&A Expenses: United Rentals, Inc. vs J.B. Hunt Transport Services, Inc.
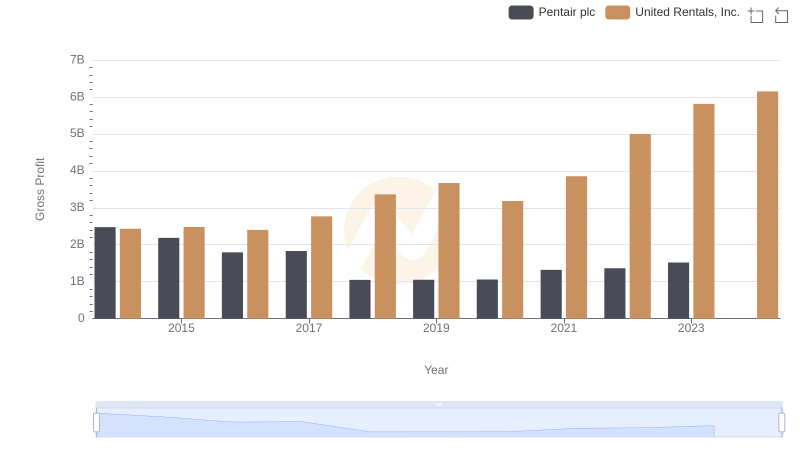
Who Generates Higher Gross Profit? United Rentals, Inc. or Pentair plc
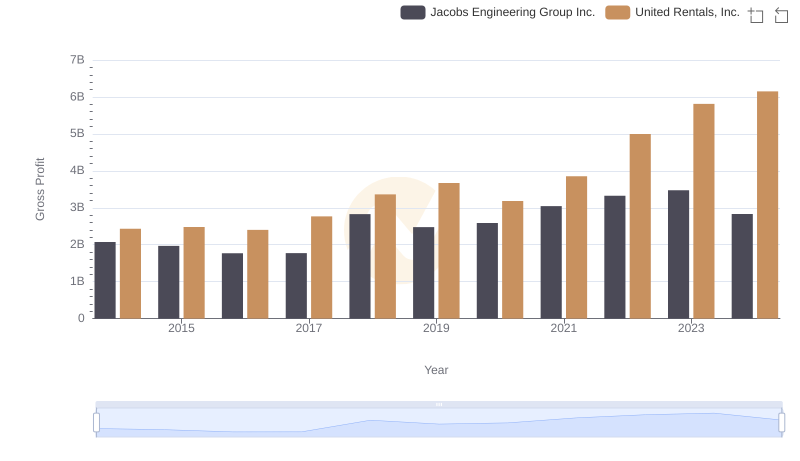
United Rentals, Inc. and Jacobs Engineering Group Inc.: A Detailed Gross Profit Analysis
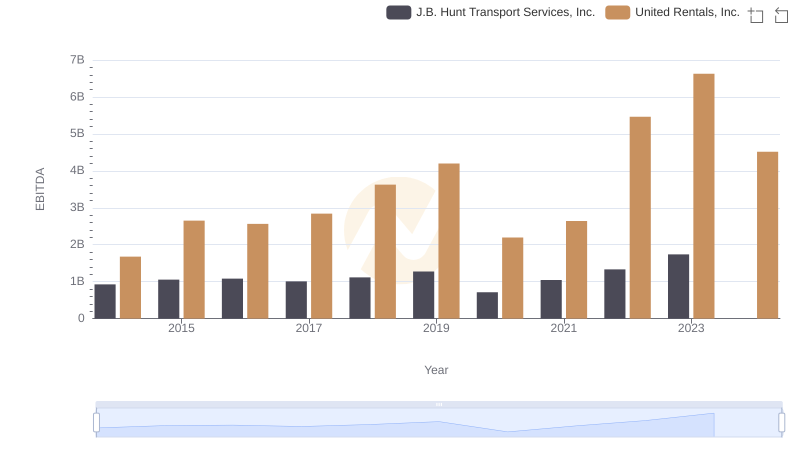
EBITDA Analysis: Evaluating United Rentals, Inc. Against J.B. Hunt Transport Services, Inc.