| __timestamp | C.H. Robinson Worldwide, Inc. | United Airlines Holdings, Inc. |
|---|---|---|
| Wednesday, January 1, 2014 | 12401436000 | 29569000000 |
| Thursday, January 1, 2015 | 12259014000 | 25952000000 |
| Friday, January 1, 2016 | 11931821000 | 24856000000 |
| Sunday, January 1, 2017 | 13680857000 | 27056000000 |
| Monday, January 1, 2018 | 15269479000 | 30165000000 |
| Tuesday, January 1, 2019 | 14021726000 | 30786000000 |
| Wednesday, January 1, 2020 | 15037716000 | 20385000000 |
| Friday, January 1, 2021 | 21493659000 | 23913000000 |
| Saturday, January 1, 2022 | 22826428000 | 34315000000 |
| Sunday, January 1, 2023 | 16457570000 | 38518000000 |
| Monday, January 1, 2024 | 16416191000 | 37643000000 |
Unleashing the power of data
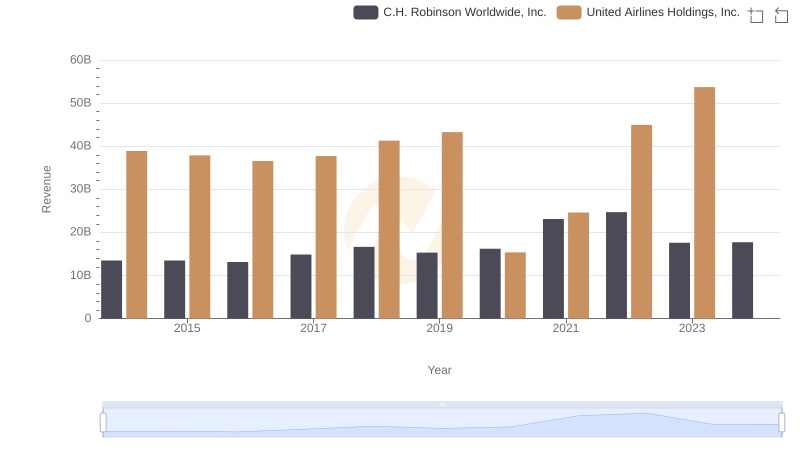
In the ever-evolving landscape of American business, United Airlines Holdings, Inc. and C.H. Robinson Worldwide, Inc. stand as titans in their respective industries. Over the past decade, these companies have navigated the turbulent waters of economic change, with their cost of revenue reflecting their strategic maneuvers.
From 2014 to 2023, United Airlines consistently reported higher costs, peaking in 2023 with a staggering 35% increase from 2014. This reflects the airline's expansive growth and operational challenges. In contrast, C.H. Robinson, a leader in logistics, saw a more modest 33% rise in costs over the same period, highlighting its efficiency in managing supply chain complexities.
Interestingly, 2020 marked a dip for United Airlines, likely due to the pandemic's impact, while C.H. Robinson's costs surged in 2021, possibly due to increased demand for logistics services. Missing data for 2024 suggests ongoing adjustments in these dynamic industries.
Comparing Revenue Performance: United Airlines Holdings, Inc. or C.H. Robinson Worldwide, Inc.?
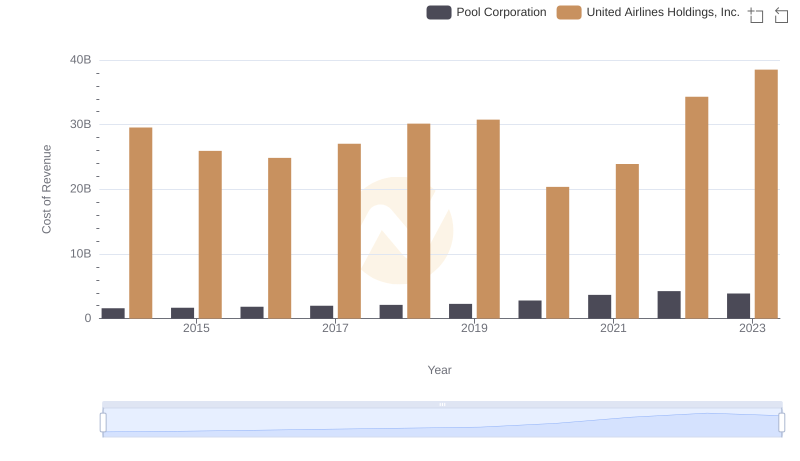
Cost Insights: Breaking Down United Airlines Holdings, Inc. and Pool Corporation's Expenses
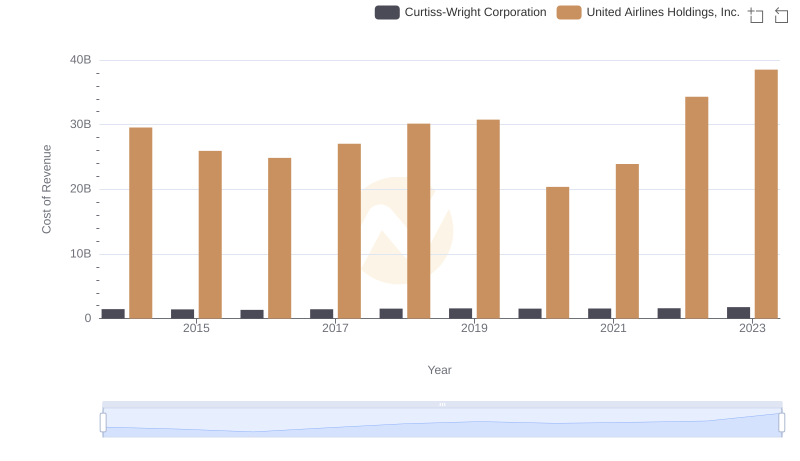
Cost of Revenue: Key Insights for United Airlines Holdings, Inc. and Curtiss-Wright Corporation
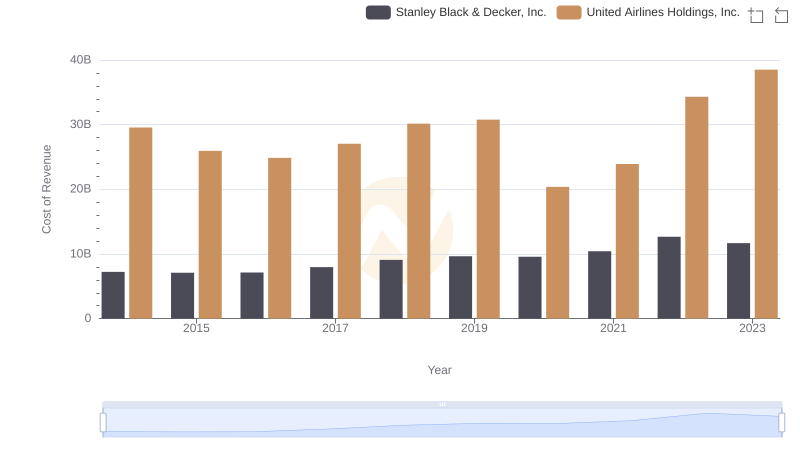
United Airlines Holdings, Inc. vs Stanley Black & Decker, Inc.: Efficiency in Cost of Revenue Explored
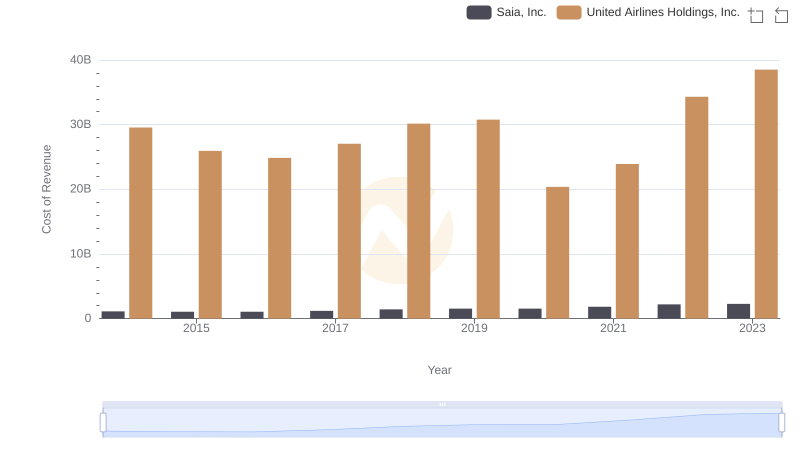
Comparing Cost of Revenue Efficiency: United Airlines Holdings, Inc. vs Saia, Inc.
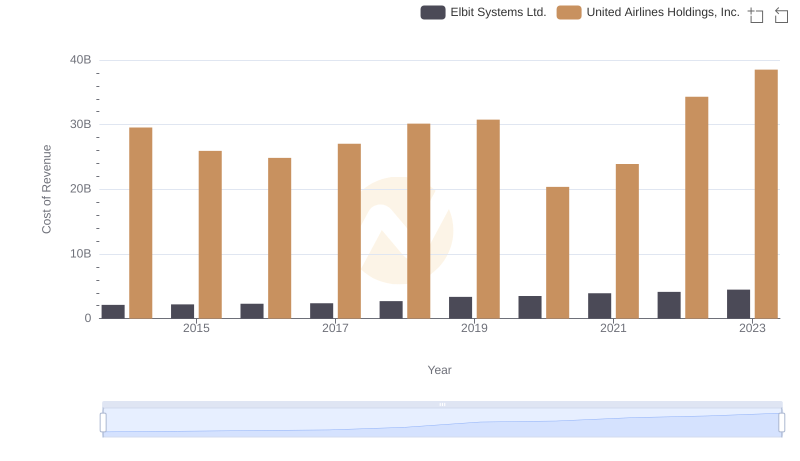
Cost Insights: Breaking Down United Airlines Holdings, Inc. and Elbit Systems Ltd.'s Expenses
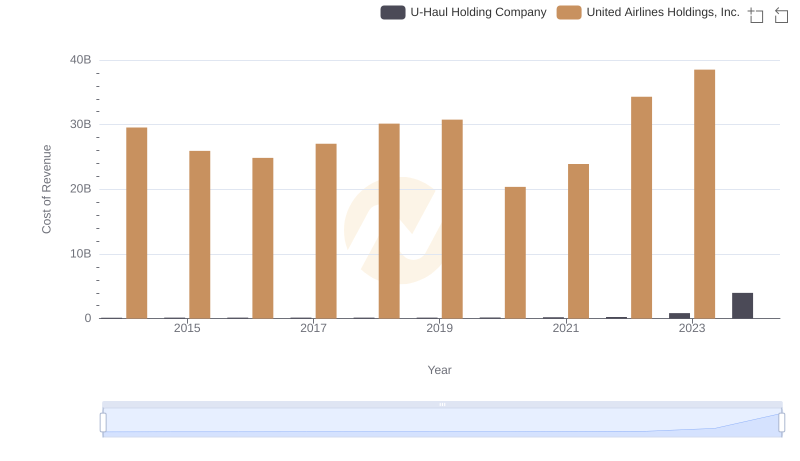
Cost of Revenue: Key Insights for United Airlines Holdings, Inc. and U-Haul Holding Company
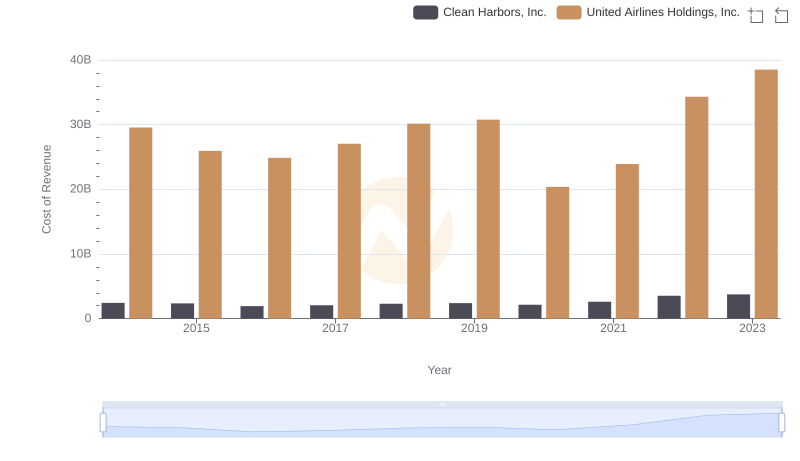
Cost Insights: Breaking Down United Airlines Holdings, Inc. and Clean Harbors, Inc.'s Expenses
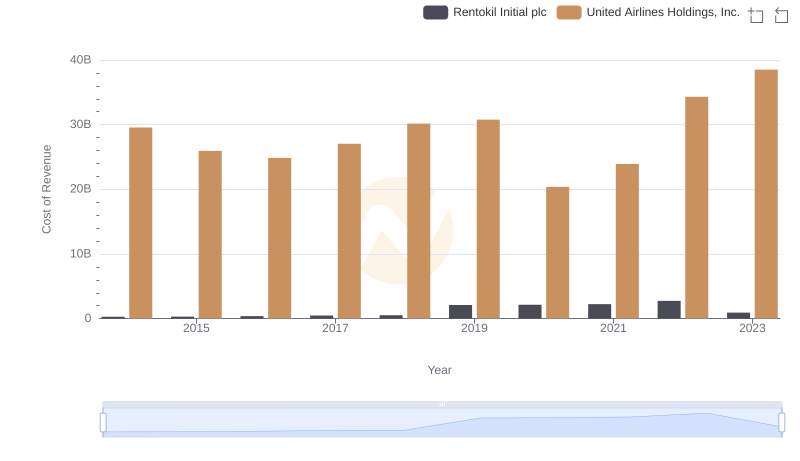
Comparing Cost of Revenue Efficiency: United Airlines Holdings, Inc. vs Rentokil Initial plc
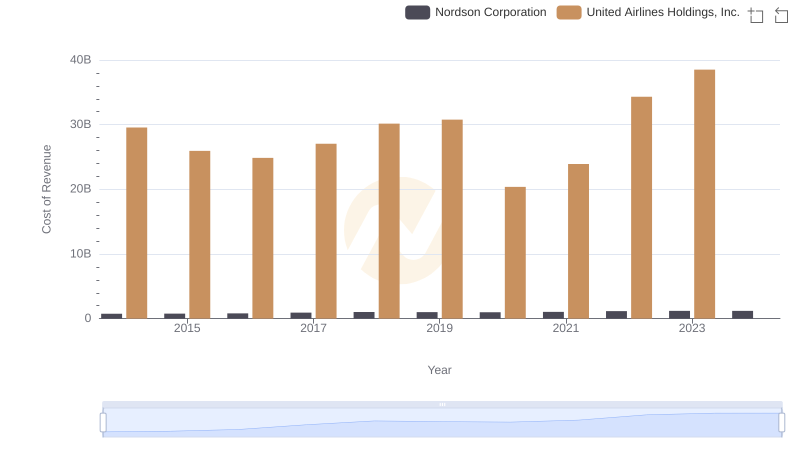
Comparing Cost of Revenue Efficiency: United Airlines Holdings, Inc. vs Nordson Corporation
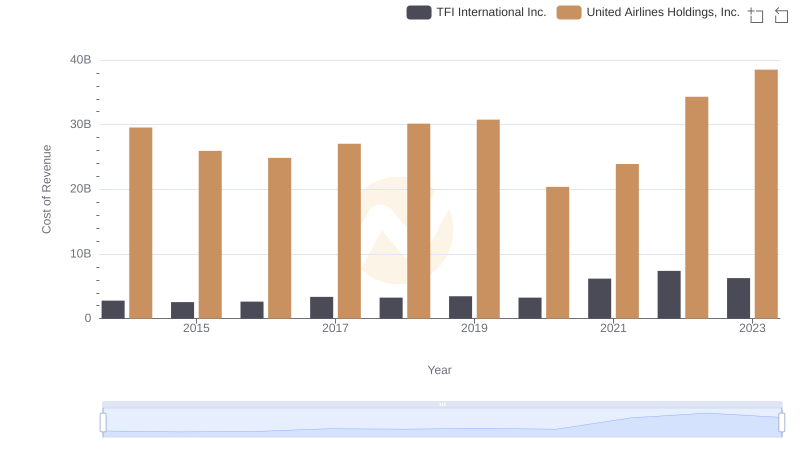
Cost of Revenue Comparison: United Airlines Holdings, Inc. vs TFI International Inc.
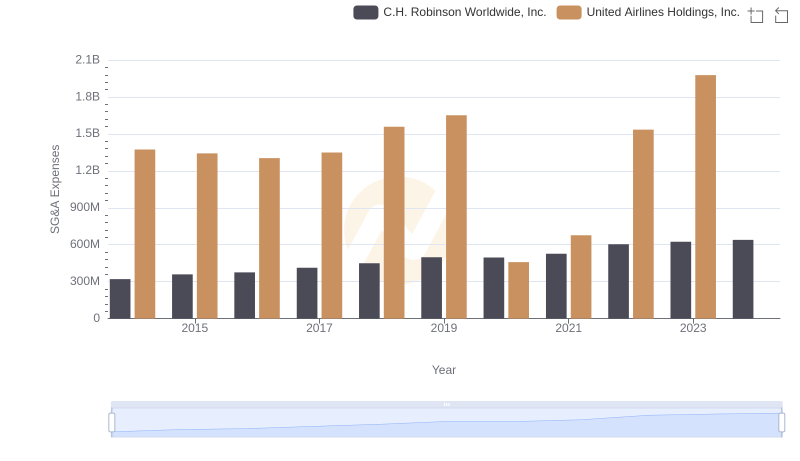
United Airlines Holdings, Inc. vs C.H. Robinson Worldwide, Inc.: SG&A Expense Trends