| __timestamp | Saia, Inc. | United Airlines Holdings, Inc. |
|---|---|---|
| Wednesday, January 1, 2014 | 1113053000 | 29569000000 |
| Thursday, January 1, 2015 | 1067191000 | 25952000000 |
| Friday, January 1, 2016 | 1058979000 | 24856000000 |
| Sunday, January 1, 2017 | 1203464000 | 27056000000 |
| Monday, January 1, 2018 | 1423779000 | 30165000000 |
| Tuesday, January 1, 2019 | 1537082000 | 30786000000 |
| Wednesday, January 1, 2020 | 1538518000 | 20385000000 |
| Friday, January 1, 2021 | 1837017000 | 23913000000 |
| Saturday, January 1, 2022 | 2201094000 | 34315000000 |
| Sunday, January 1, 2023 | 2282501000 | 38518000000 |
| Monday, January 1, 2024 | 37643000000 |
Unleashing insights
The aviation and transportation industries have long been pivotal in shaping the global economy. As we dive into the financial metrics of two significant players—United Airlines Holdings, Inc. and Saia, Inc.—we uncover intriguing insights into their cost of revenue efficiency over the past decade. This analysis not only highlights their operational performance but also offers a glimpse into how these companies navigate the complexities of their respective markets.
From 2014 to 2023, both United Airlines and Saia have demonstrated varying levels of cost management in their operations. United Airlines, a titan in the aviation sector, has consistently reported higher costs associated with revenue generation compared to Saia, which operates in the less capital-intensive trucking industry.
In 2014, United Airlines reported a staggering $29.57 billion in cost of revenue, dwarfing Saia's $1.11 billion. This trend continued throughout the decade, with United Airlines peaking at approximately $38.52 billion in 2023, while Saia's costs rose to about $2.28 billion. The data reveals that United Airlines' cost of revenue has increased by nearly 30% over the last decade, while Saia's costs have seen a more modest increase of about 105%.
When evaluating efficiency, it is essential to consider the cost of revenue relative to the scale of operations. United Airlines, despite its higher absolute costs, operates on a much larger scale. In 2023, the cost of revenue for United Airlines represented approximately 70% of its total revenue, while Saia's cost accounted for about 60%. This indicates that while both companies have managed to grow their revenue, United Airlines faces greater challenges in maintaining efficiency.
The stark contrast in their cost structures raises questions about operational strategies. United Airlines, operating in a highly regulated and competitive environment, must balance high operational costs with the need for customer satisfaction and safety. Conversely, Saia benefits from a more streamlined operation, which allows for greater flexibility in managing costs.
As we look ahead, both companies will need to adapt to changing market conditions. The aviation industry is poised for recovery post-pandemic, but rising fuel prices and labor costs could continue to pressure margins for United Airlines. On the other hand, Saia's growth trajectory suggests a strong demand for freight services, but it too must navigate challenges such as driver shortages and fluctuating fuel costs.
In conclusion, the comparison of cost of revenue efficiency between United Airlines and Saia reveals not only their financial health but also their strategic positioning within their industries. As these companies continue to evolve, understanding their cost structures will be crucial for investors and stakeholders alike.
The financial performance of United Airlines and Saia over the last decade serves as a compelling case study in operational efficiency. As both companies chart their paths forward, the lessons learned from their cost management strategies will undoubtedly shape their future success.
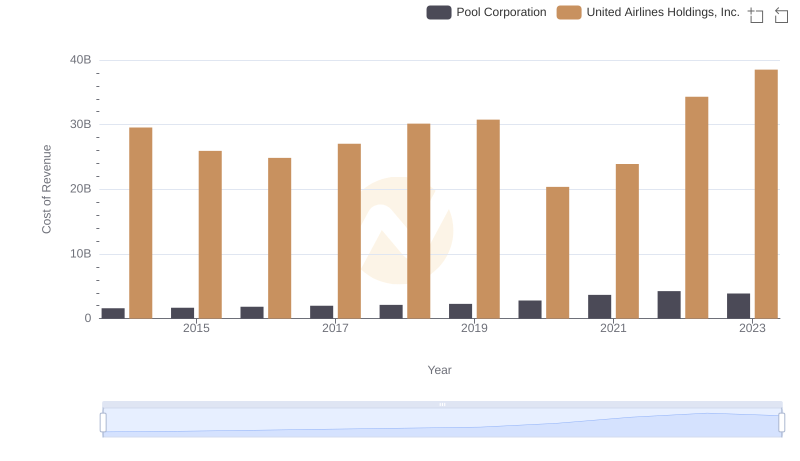
Cost Insights: Breaking Down United Airlines Holdings, Inc. and Pool Corporation's Expenses
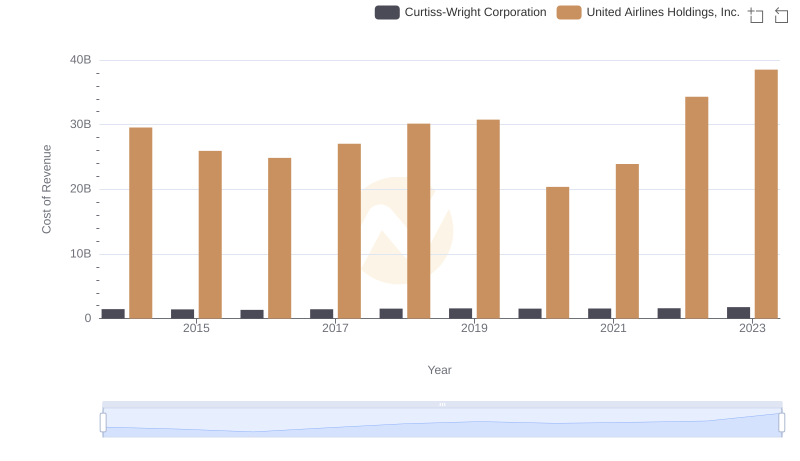
Cost of Revenue: Key Insights for United Airlines Holdings, Inc. and Curtiss-Wright Corporation
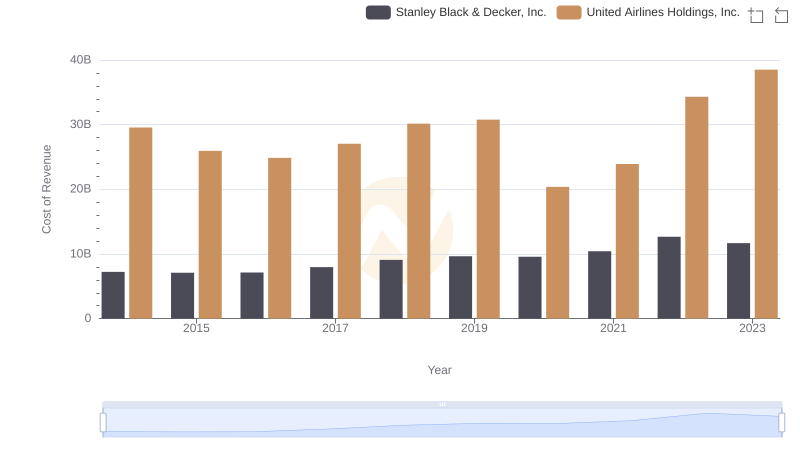
United Airlines Holdings, Inc. vs Stanley Black & Decker, Inc.: Efficiency in Cost of Revenue Explored
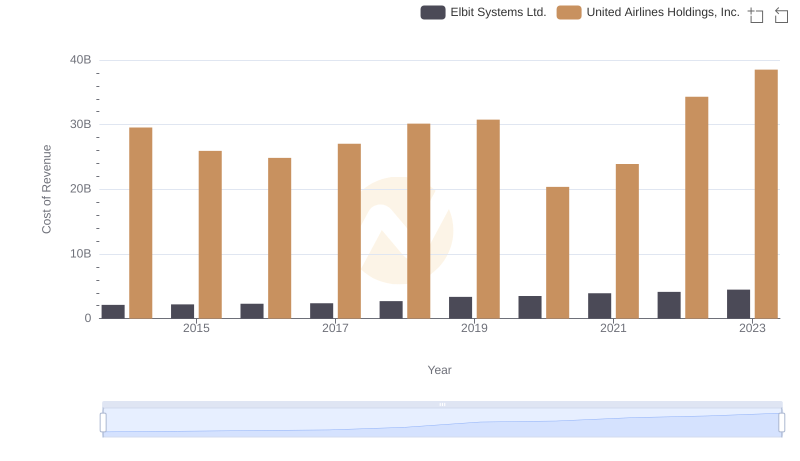
Cost Insights: Breaking Down United Airlines Holdings, Inc. and Elbit Systems Ltd.'s Expenses
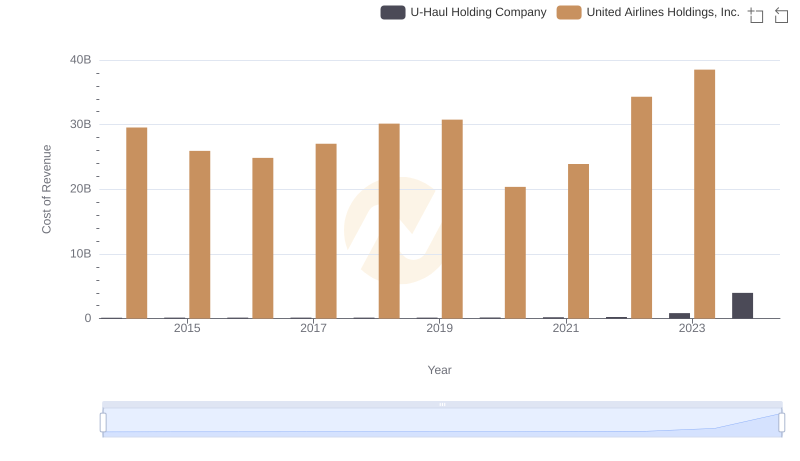
Cost of Revenue: Key Insights for United Airlines Holdings, Inc. and U-Haul Holding Company
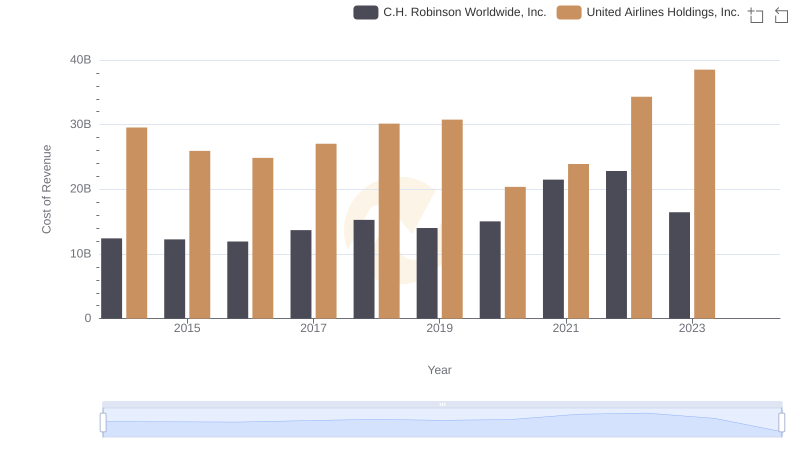
Cost of Revenue Comparison: United Airlines Holdings, Inc. vs C.H. Robinson Worldwide, Inc.
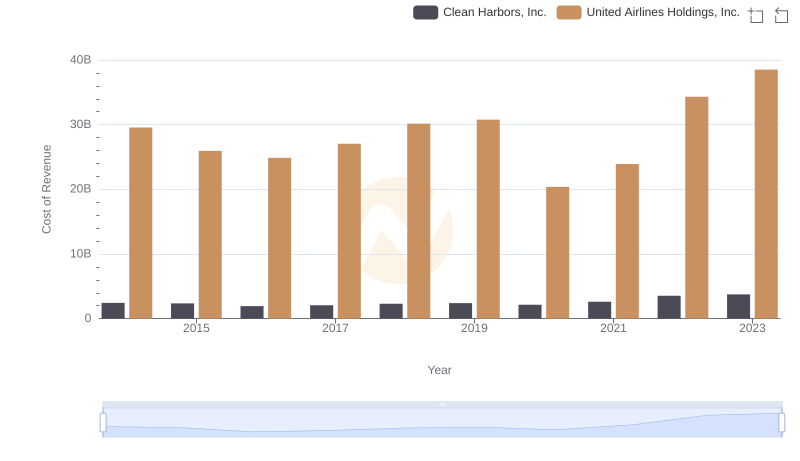
Cost Insights: Breaking Down United Airlines Holdings, Inc. and Clean Harbors, Inc.'s Expenses
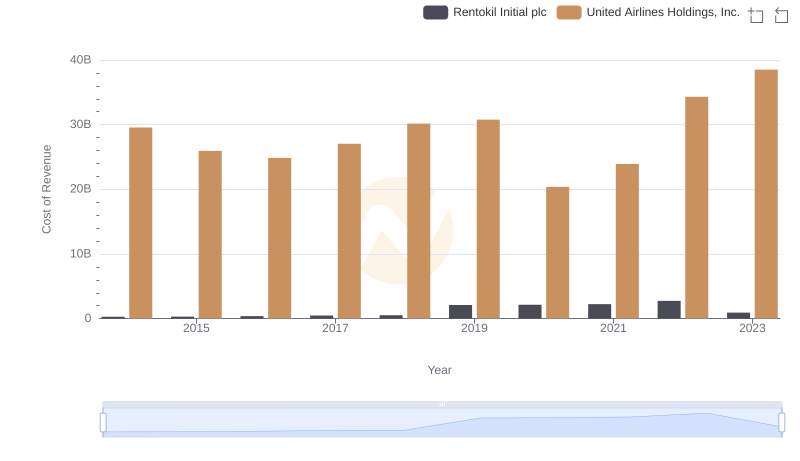
Comparing Cost of Revenue Efficiency: United Airlines Holdings, Inc. vs Rentokil Initial plc
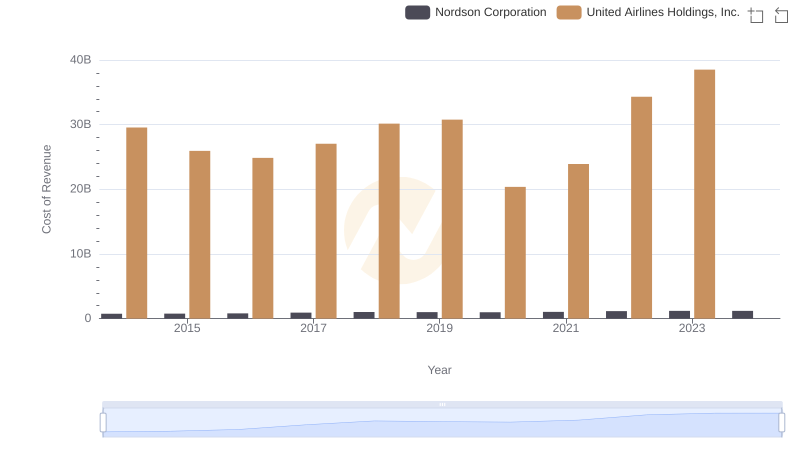
Comparing Cost of Revenue Efficiency: United Airlines Holdings, Inc. vs Nordson Corporation
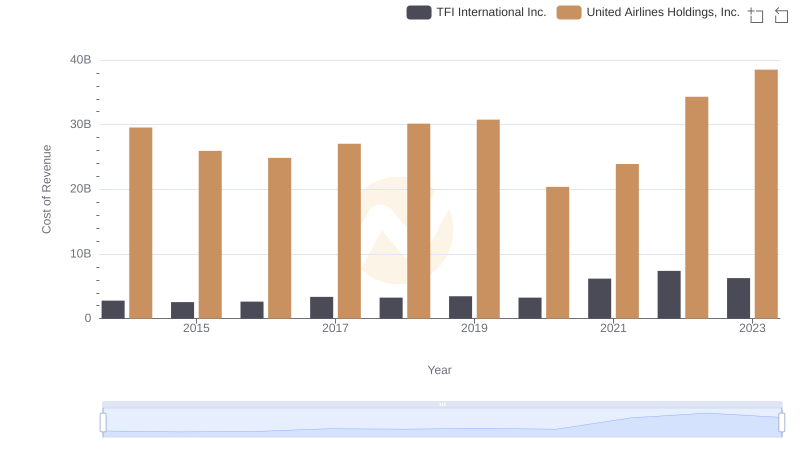
Cost of Revenue Comparison: United Airlines Holdings, Inc. vs TFI International Inc.
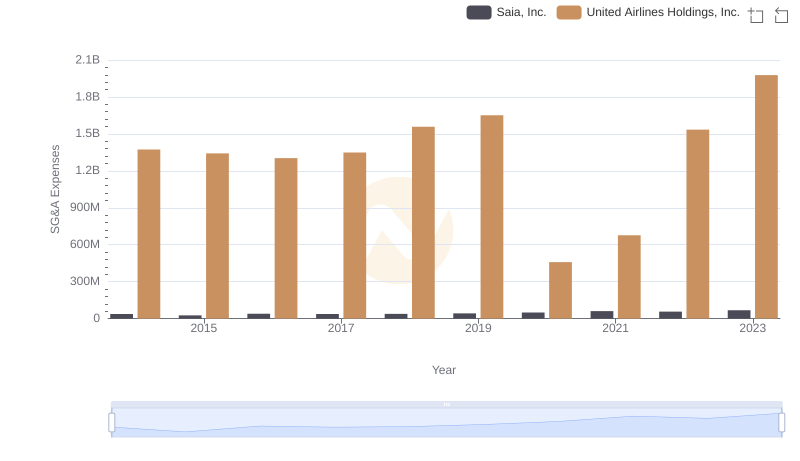
United Airlines Holdings, Inc. and Saia, Inc.: SG&A Spending Patterns Compared