| __timestamp | Elbit Systems Ltd. | United Airlines Holdings, Inc. |
|---|---|---|
| Wednesday, January 1, 2014 | 2133151000 | 29569000000 |
| Thursday, January 1, 2015 | 2210528000 | 25952000000 |
| Friday, January 1, 2016 | 2300636000 | 24856000000 |
| Sunday, January 1, 2017 | 2379905000 | 27056000000 |
| Monday, January 1, 2018 | 2707505000 | 30165000000 |
| Tuesday, January 1, 2019 | 3371933000 | 30786000000 |
| Wednesday, January 1, 2020 | 3497465000 | 20385000000 |
| Friday, January 1, 2021 | 3920473000 | 23913000000 |
| Saturday, January 1, 2022 | 4138266000 | 34315000000 |
| Sunday, January 1, 2023 | 4491790000 | 38518000000 |
| Monday, January 1, 2024 | 37643000000 |
Unleashing insights
In the ever-evolving landscape of global business, understanding cost structures is crucial. This analysis delves into the cost of revenue for United Airlines Holdings, Inc. and Elbit Systems Ltd. from 2014 to 2023. Over this period, United Airlines consistently reported higher costs, peaking in 2023 with a 35% increase from its 2020 low. This reflects the airline industry's volatile nature, influenced by factors like fuel prices and global travel demand.
Conversely, Elbit Systems, a defense electronics company, showed a steady rise in costs, with a 110% increase from 2014 to 2023. This growth aligns with the rising global defense expenditure. The data highlights the contrasting dynamics of these industries, offering insights into their operational challenges and strategic priorities. As businesses navigate post-pandemic recovery, understanding these trends is vital for stakeholders and investors alike.
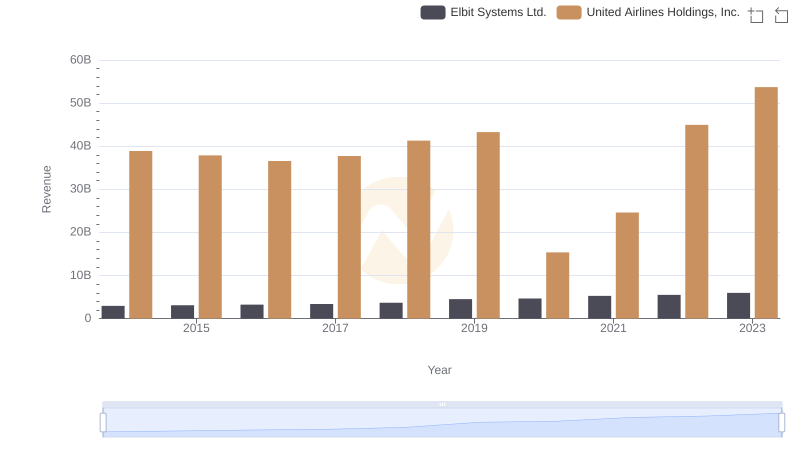
United Airlines Holdings, Inc. vs Elbit Systems Ltd.: Examining Key Revenue Metrics
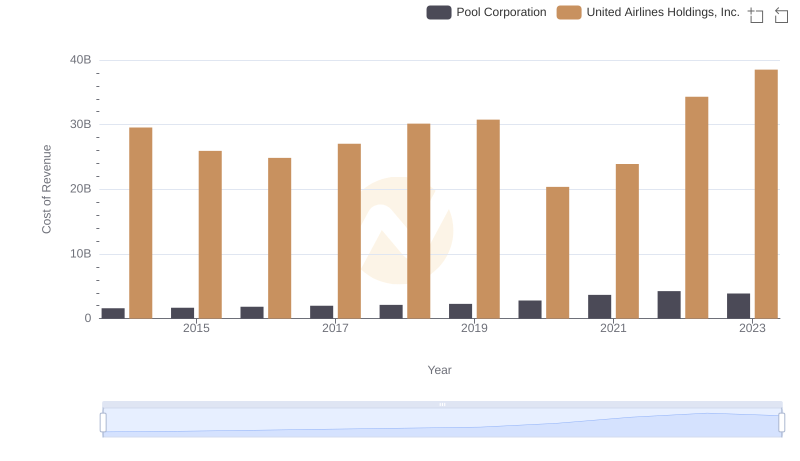
Cost Insights: Breaking Down United Airlines Holdings, Inc. and Pool Corporation's Expenses
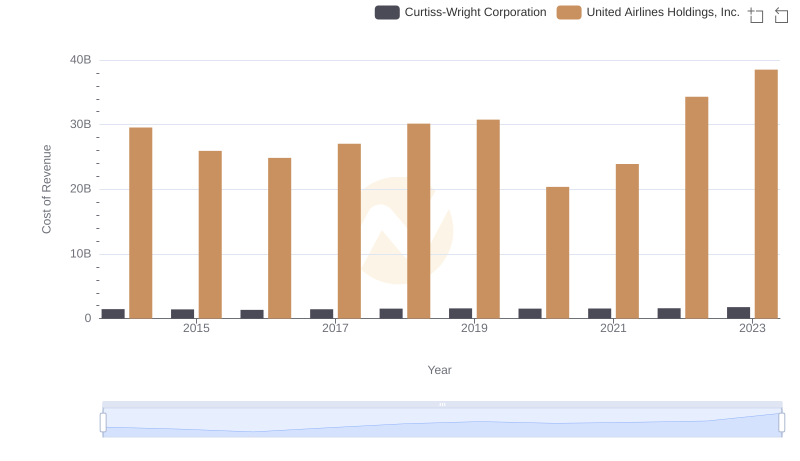
Cost of Revenue: Key Insights for United Airlines Holdings, Inc. and Curtiss-Wright Corporation
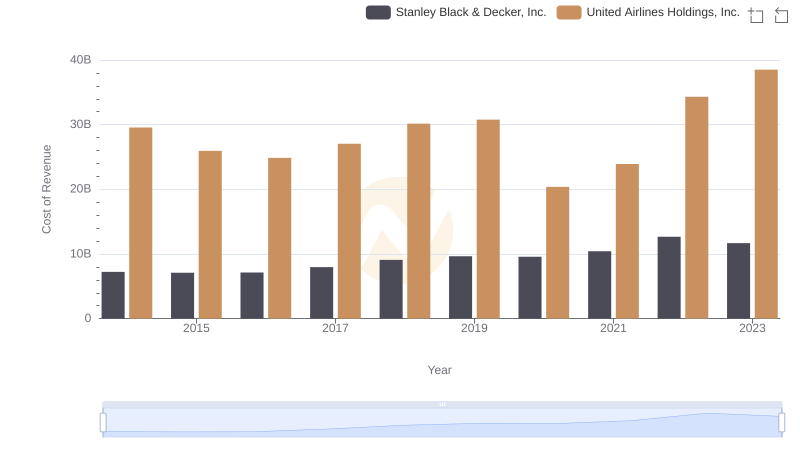
United Airlines Holdings, Inc. vs Stanley Black & Decker, Inc.: Efficiency in Cost of Revenue Explored
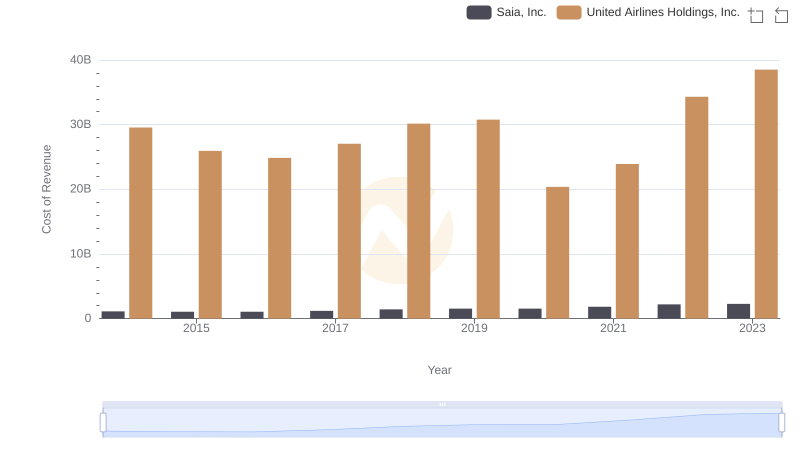
Comparing Cost of Revenue Efficiency: United Airlines Holdings, Inc. vs Saia, Inc.
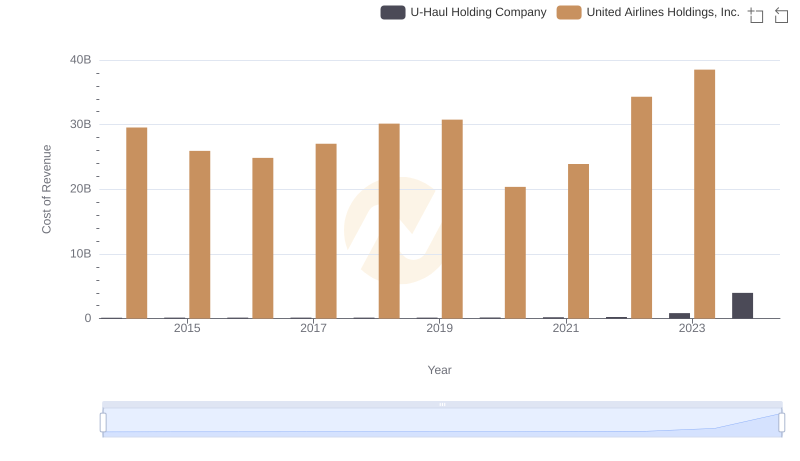
Cost of Revenue: Key Insights for United Airlines Holdings, Inc. and U-Haul Holding Company
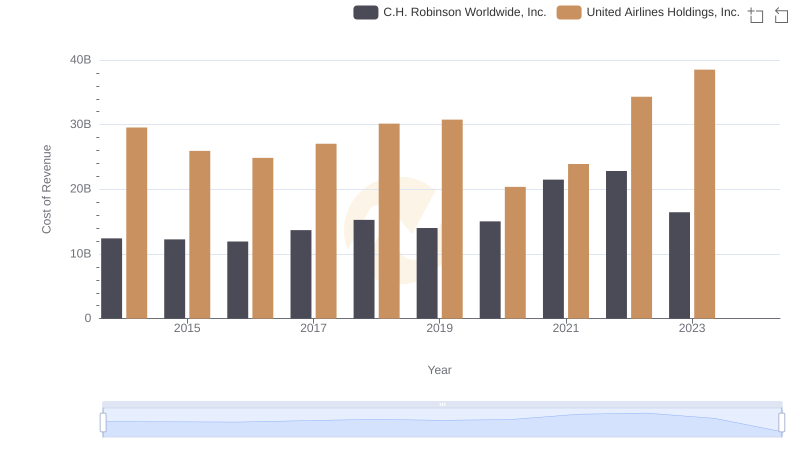
Cost of Revenue Comparison: United Airlines Holdings, Inc. vs C.H. Robinson Worldwide, Inc.
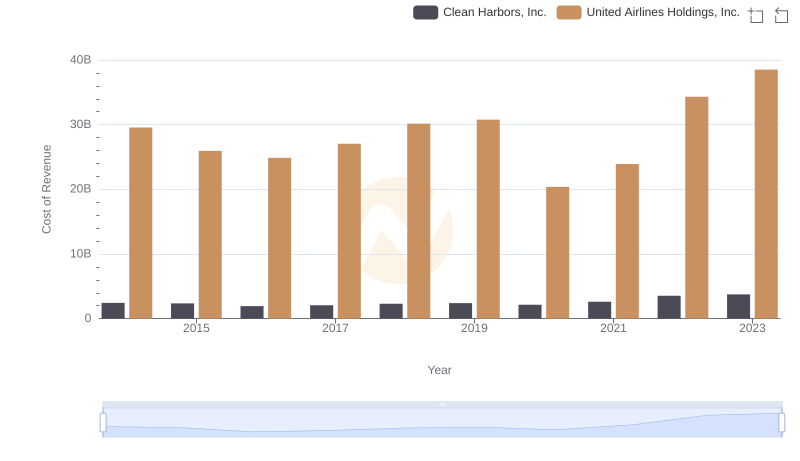
Cost Insights: Breaking Down United Airlines Holdings, Inc. and Clean Harbors, Inc.'s Expenses
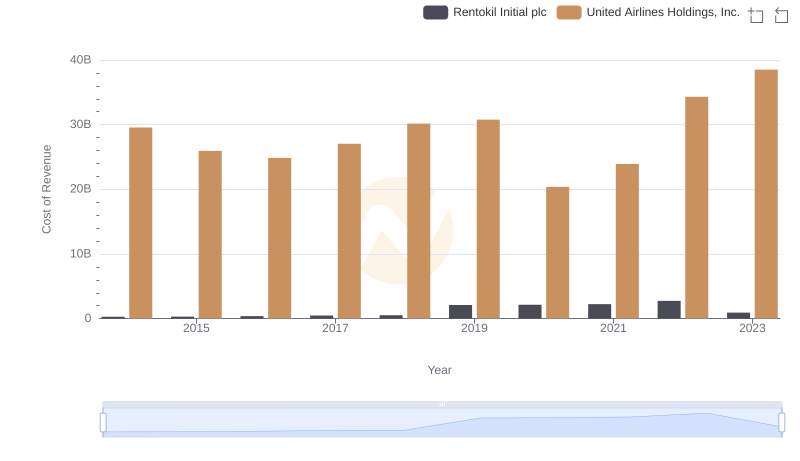
Comparing Cost of Revenue Efficiency: United Airlines Holdings, Inc. vs Rentokil Initial plc
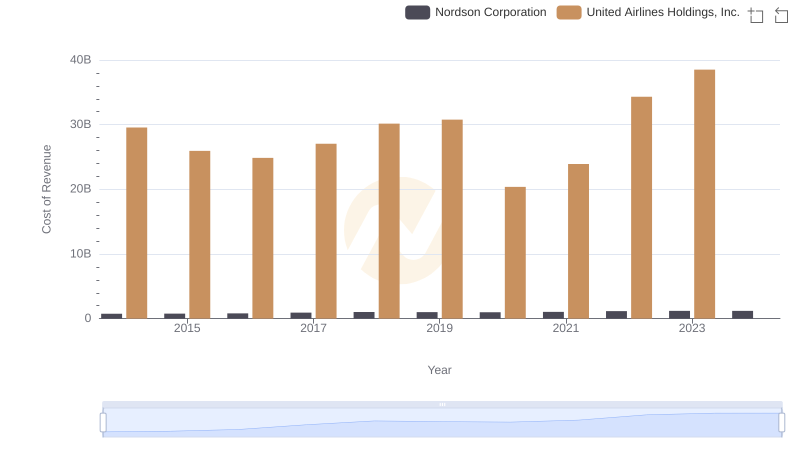
Comparing Cost of Revenue Efficiency: United Airlines Holdings, Inc. vs Nordson Corporation
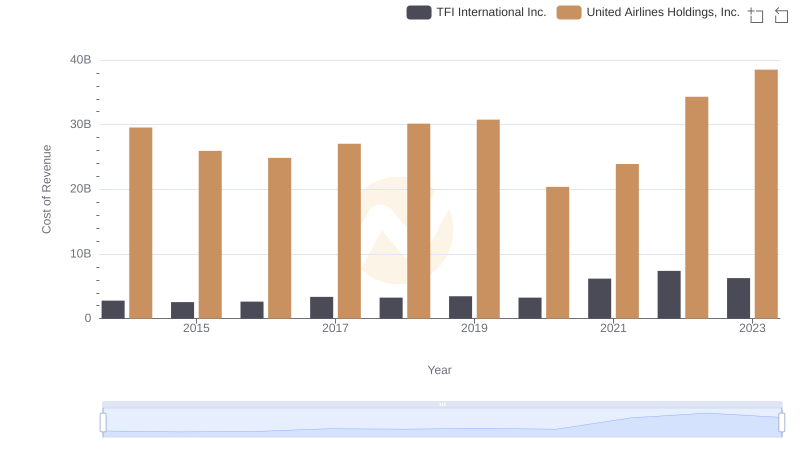
Cost of Revenue Comparison: United Airlines Holdings, Inc. vs TFI International Inc.
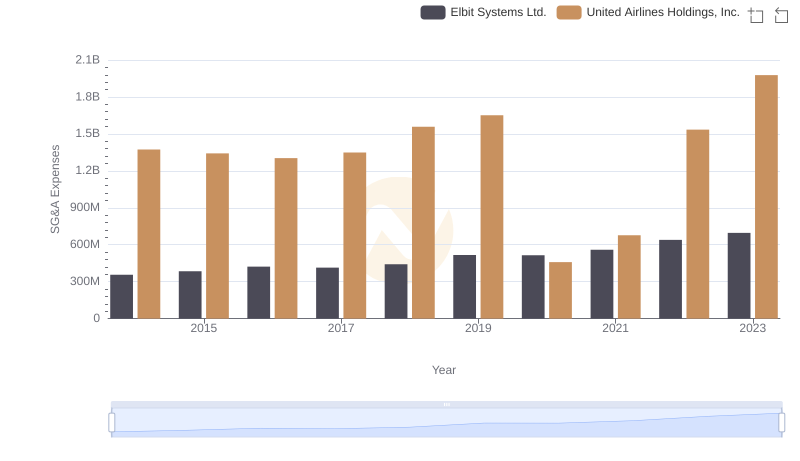
United Airlines Holdings, Inc. and Elbit Systems Ltd.: SG&A Spending Patterns Compared