| __timestamp | C.H. Robinson Worldwide, Inc. | United Airlines Holdings, Inc. |
|---|---|---|
| Wednesday, January 1, 2014 | 13470067000 | 38901000000 |
| Thursday, January 1, 2015 | 13476084000 | 37864000000 |
| Friday, January 1, 2016 | 13144413000 | 36556000000 |
| Sunday, January 1, 2017 | 14869380000 | 37736000000 |
| Monday, January 1, 2018 | 16631172000 | 41303000000 |
| Tuesday, January 1, 2019 | 15309508000 | 43259000000 |
| Wednesday, January 1, 2020 | 16207106000 | 15355000000 |
| Friday, January 1, 2021 | 23102138000 | 24634000000 |
| Saturday, January 1, 2022 | 24696625000 | 44955000000 |
| Sunday, January 1, 2023 | 17596443000 | 53717000000 |
| Monday, January 1, 2024 | 17724956000 | 57063000000 |
Unveiling the hidden dimensions of data
In the ever-evolving landscape of American business, two titans stand out in their respective industries: United Airlines Holdings, Inc. and C.H. Robinson Worldwide, Inc. Over the past decade, these companies have showcased contrasting revenue trajectories, reflecting the dynamic nature of the airline and logistics sectors.
From 2014 to 2023, United Airlines experienced a remarkable revenue growth of approximately 38%, despite a significant dip in 2020 due to the global pandemic. By 2023, their revenue soared to over $53 billion, highlighting a robust recovery and expansion strategy.
Conversely, C.H. Robinson Worldwide, a leader in logistics, saw a more modest revenue increase of around 32% over the same period. Their peak revenue in 2022 reached nearly $25 billion, underscoring their steady growth amidst global supply chain challenges.
This comparison not only highlights the resilience of these companies but also offers insights into the broader economic trends shaping their industries.
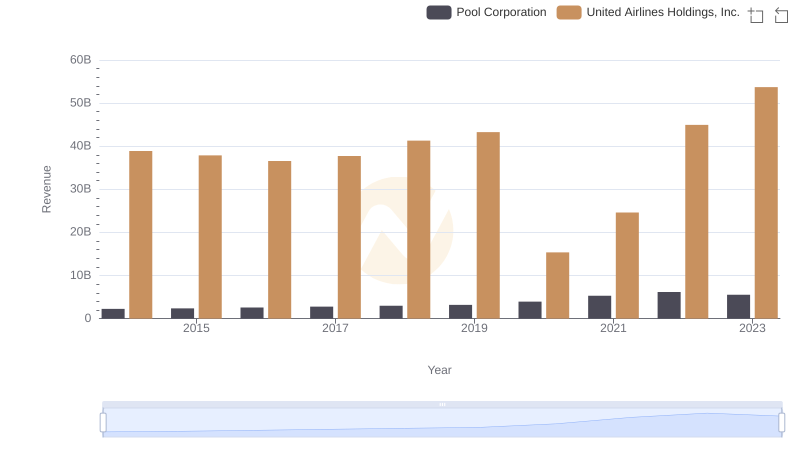
Revenue Showdown: United Airlines Holdings, Inc. vs Pool Corporation

United Airlines Holdings, Inc. vs Elbit Systems Ltd.: Examining Key Revenue Metrics
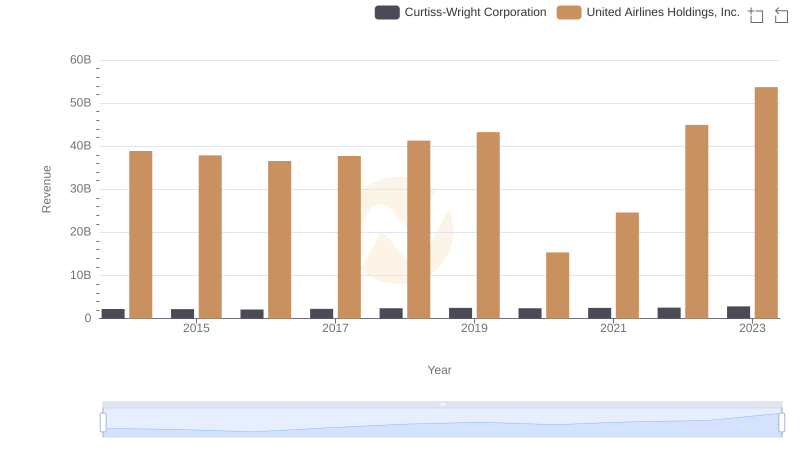
United Airlines Holdings, Inc. vs Curtiss-Wright Corporation: Annual Revenue Growth Compared
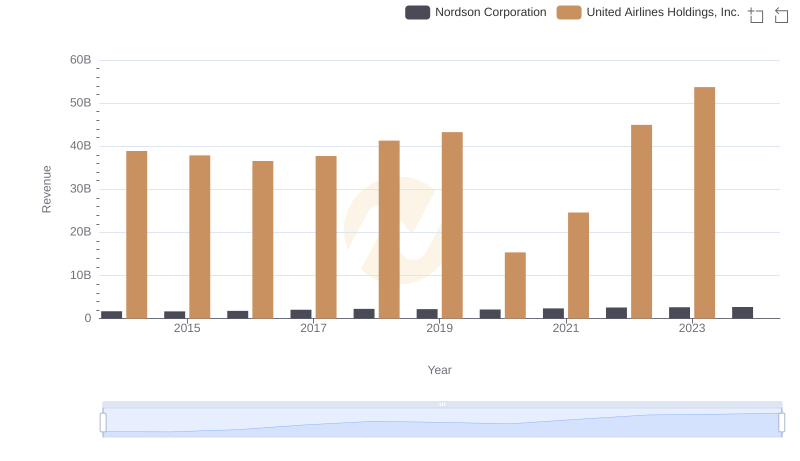
Revenue Insights: United Airlines Holdings, Inc. and Nordson Corporation Performance Compared
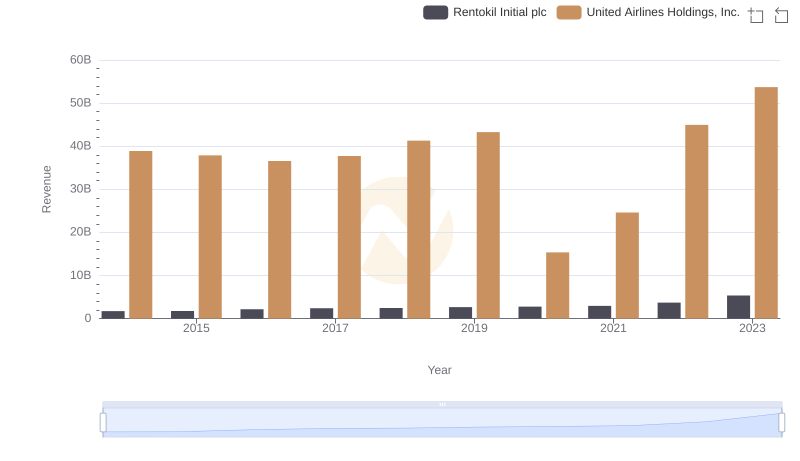
Who Generates More Revenue? United Airlines Holdings, Inc. or Rentokil Initial plc
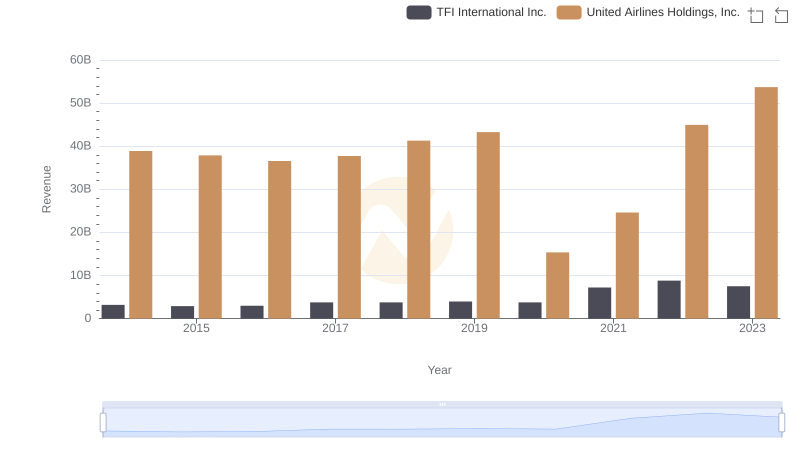
Who Generates More Revenue? United Airlines Holdings, Inc. or TFI International Inc.
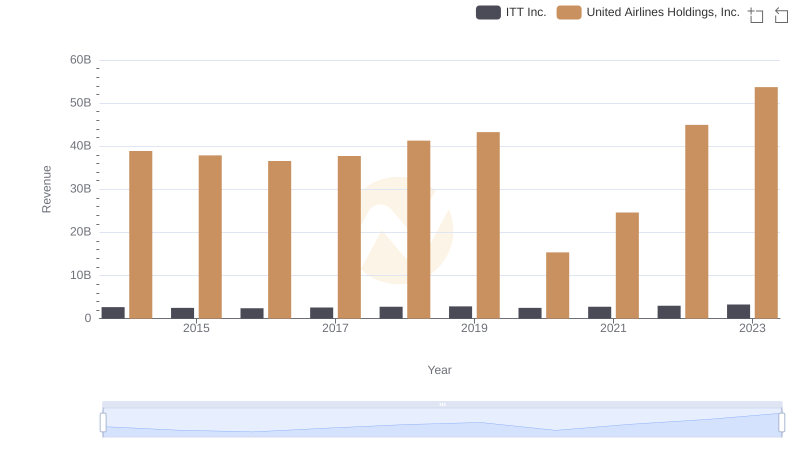
Revenue Showdown: United Airlines Holdings, Inc. vs ITT Inc.
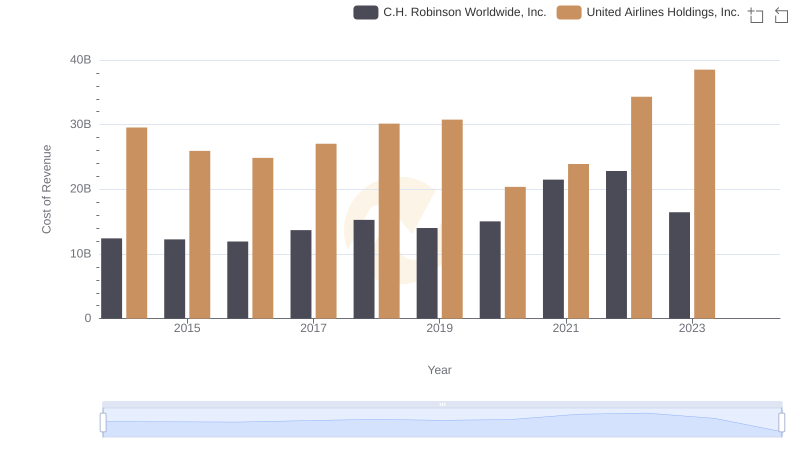
Cost of Revenue Comparison: United Airlines Holdings, Inc. vs C.H. Robinson Worldwide, Inc.
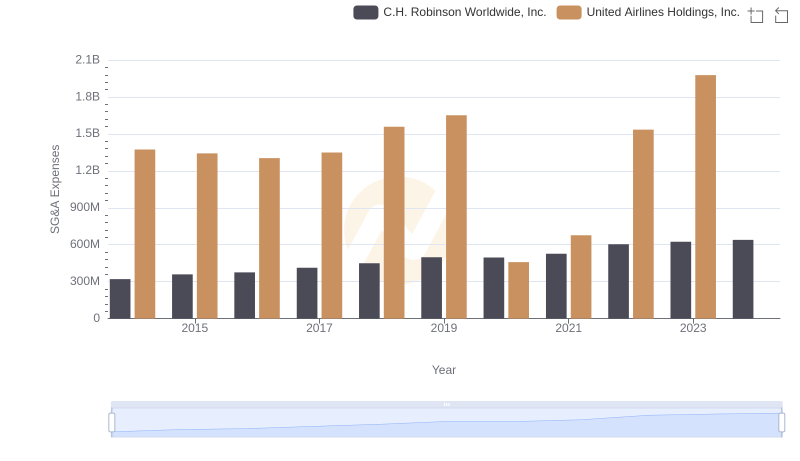
United Airlines Holdings, Inc. vs C.H. Robinson Worldwide, Inc.: SG&A Expense Trends