| __timestamp | Curtiss-Wright Corporation | United Airlines Holdings, Inc. |
|---|---|---|
| Wednesday, January 1, 2014 | 1466610000 | 29569000000 |
| Thursday, January 1, 2015 | 1422428000 | 25952000000 |
| Friday, January 1, 2016 | 1358448000 | 24856000000 |
| Sunday, January 1, 2017 | 1452431000 | 27056000000 |
| Monday, January 1, 2018 | 1540574000 | 30165000000 |
| Tuesday, January 1, 2019 | 1589216000 | 30786000000 |
| Wednesday, January 1, 2020 | 1550109000 | 20385000000 |
| Friday, January 1, 2021 | 1572575000 | 23913000000 |
| Saturday, January 1, 2022 | 1602416000 | 34315000000 |
| Sunday, January 1, 2023 | 1778195000 | 38518000000 |
| Monday, January 1, 2024 | 1967640000 | 37643000000 |
Infusing magic into the data realm
In the ever-evolving landscape of the aviation and defense industries, understanding cost structures is crucial. United Airlines Holdings, Inc. and Curtiss-Wright Corporation, two giants in their respective fields, offer a fascinating study in contrasts. From 2014 to 2023, United Airlines saw a 30% increase in its cost of revenue, peaking at $38.5 billion in 2023. This reflects the airline's expansive operations and the challenges of managing costs in a volatile market. Meanwhile, Curtiss-Wright Corporation, a leader in engineering solutions, experienced a more modest 21% rise, reaching $1.78 billion in 2023. This steady growth underscores its strategic focus on efficiency and innovation. The data reveals how each company navigates its unique challenges, offering insights into their operational strategies. As the global economy continues to shift, these trends provide a window into the future of cost management in these critical sectors.
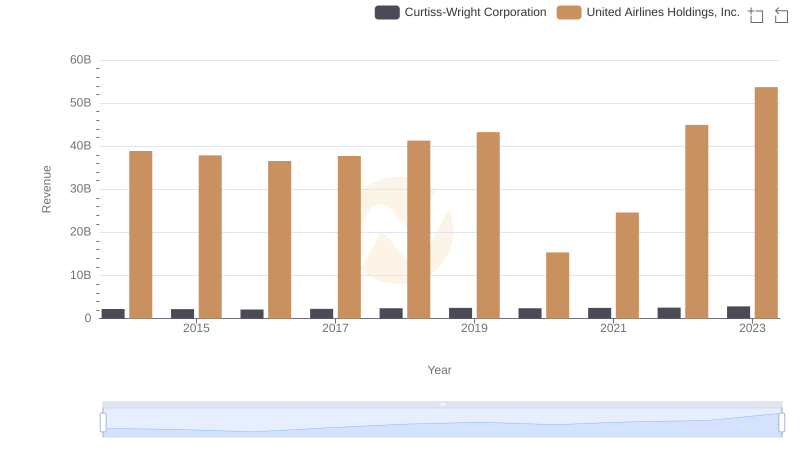
United Airlines Holdings, Inc. vs Curtiss-Wright Corporation: Annual Revenue Growth Compared
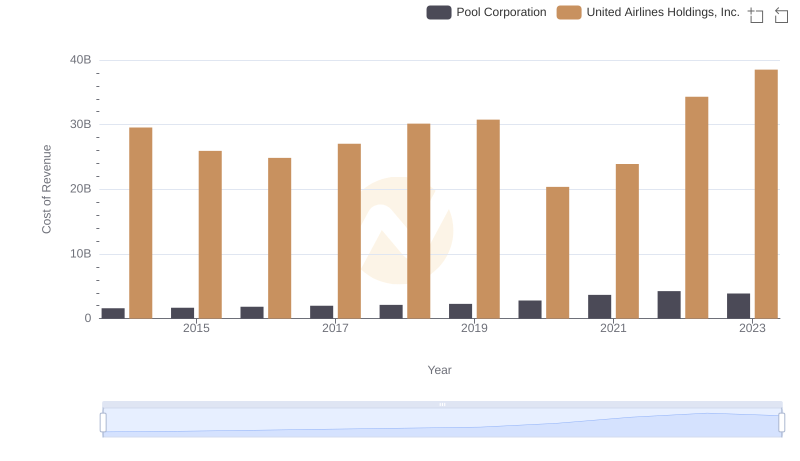
Cost Insights: Breaking Down United Airlines Holdings, Inc. and Pool Corporation's Expenses
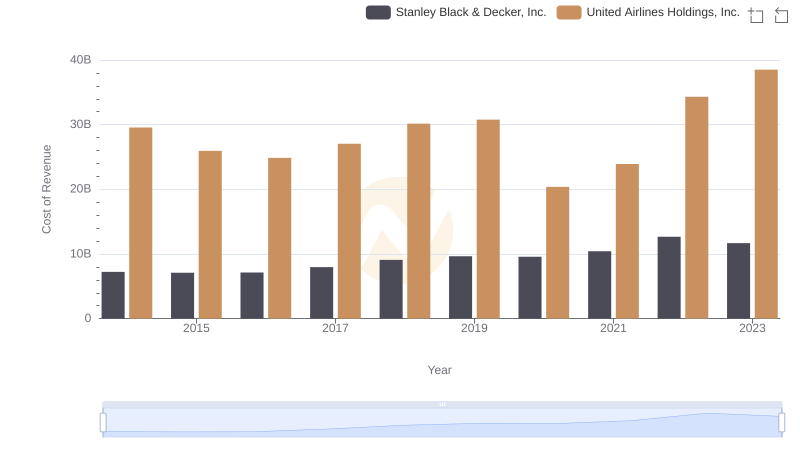
United Airlines Holdings, Inc. vs Stanley Black & Decker, Inc.: Efficiency in Cost of Revenue Explored
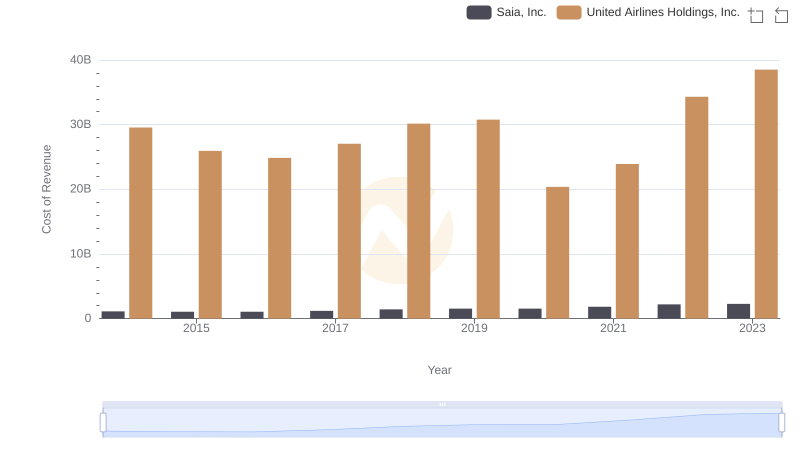
Comparing Cost of Revenue Efficiency: United Airlines Holdings, Inc. vs Saia, Inc.
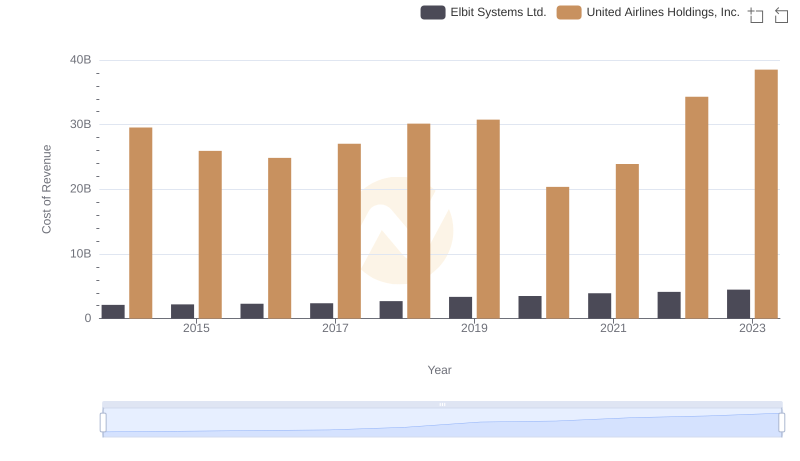
Cost Insights: Breaking Down United Airlines Holdings, Inc. and Elbit Systems Ltd.'s Expenses
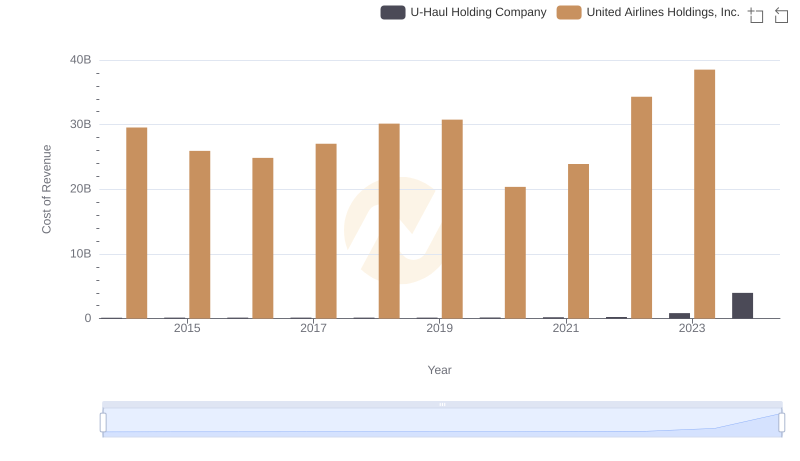
Cost of Revenue: Key Insights for United Airlines Holdings, Inc. and U-Haul Holding Company
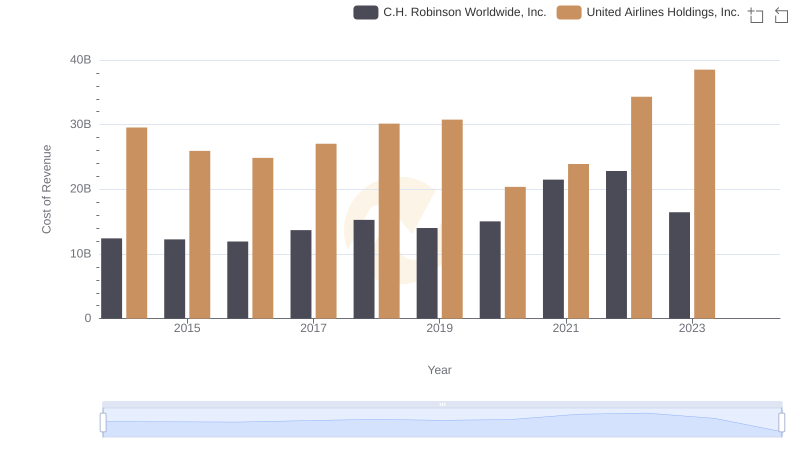
Cost of Revenue Comparison: United Airlines Holdings, Inc. vs C.H. Robinson Worldwide, Inc.
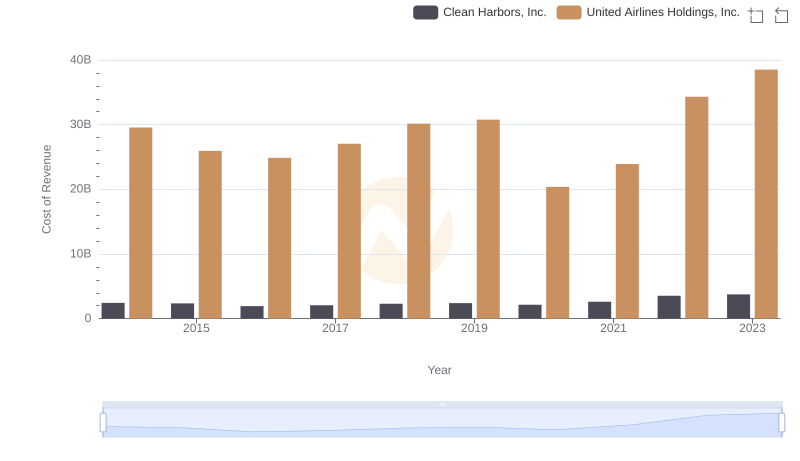
Cost Insights: Breaking Down United Airlines Holdings, Inc. and Clean Harbors, Inc.'s Expenses
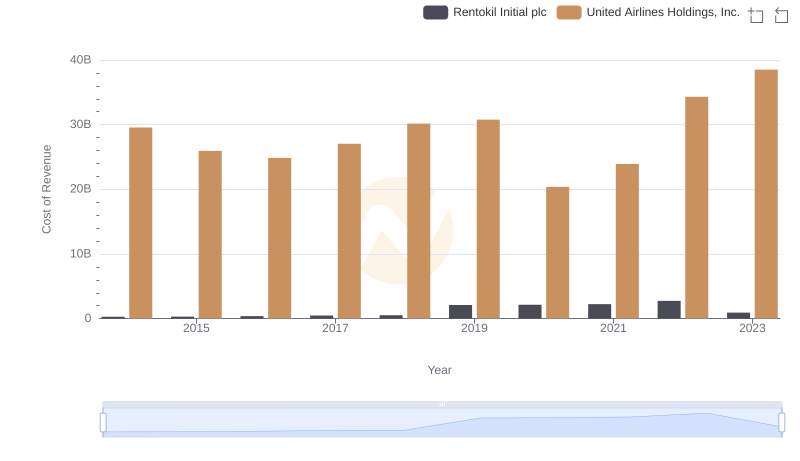
Comparing Cost of Revenue Efficiency: United Airlines Holdings, Inc. vs Rentokil Initial plc
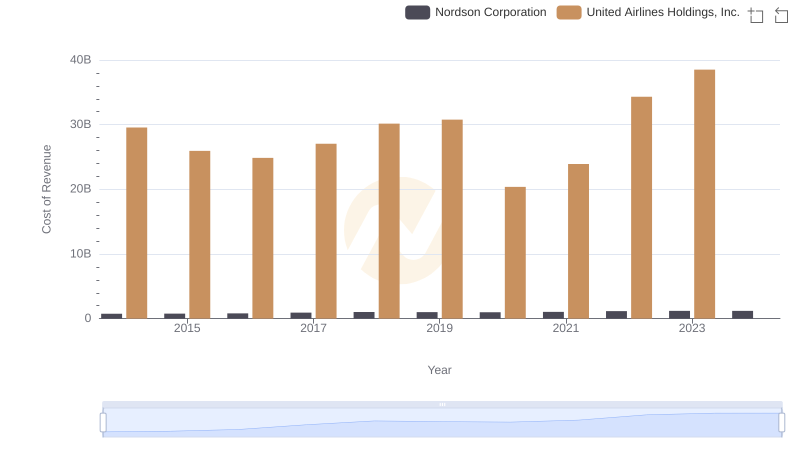
Comparing Cost of Revenue Efficiency: United Airlines Holdings, Inc. vs Nordson Corporation
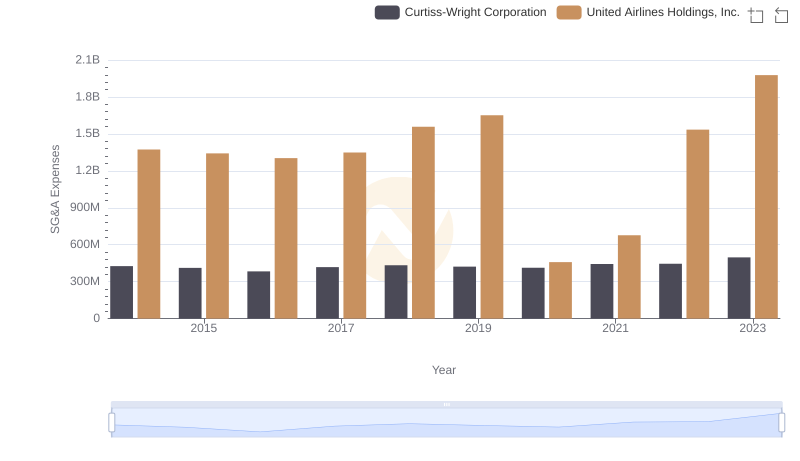
Comparing SG&A Expenses: United Airlines Holdings, Inc. vs Curtiss-Wright Corporation Trends and Insights