| __timestamp | Stanley Black & Decker, Inc. | United Airlines Holdings, Inc. |
|---|---|---|
| Wednesday, January 1, 2014 | 7235900000 | 29569000000 |
| Thursday, January 1, 2015 | 7099800000 | 25952000000 |
| Friday, January 1, 2016 | 7139700000 | 24856000000 |
| Sunday, January 1, 2017 | 7969200000 | 27056000000 |
| Monday, January 1, 2018 | 9080500000 | 30165000000 |
| Tuesday, January 1, 2019 | 9636700000 | 30786000000 |
| Wednesday, January 1, 2020 | 9566700000 | 20385000000 |
| Friday, January 1, 2021 | 10423000000 | 23913000000 |
| Saturday, January 1, 2022 | 12663300000 | 34315000000 |
| Sunday, January 1, 2023 | 11683100000 | 38518000000 |
| Monday, January 1, 2024 | 10851300000 | 37643000000 |
Unleashing insights
In the ever-evolving landscape of corporate efficiency, the cost of revenue is a critical metric. From 2014 to 2023, United Airlines Holdings, Inc. and Stanley Black & Decker, Inc. have showcased contrasting trends in managing this crucial expense. United Airlines, a titan in the aviation industry, saw its cost of revenue fluctuate, peaking in 2023 with a 30% increase from its 2014 figures. Meanwhile, Stanley Black & Decker, a leader in industrial tools, demonstrated a more stable trajectory, with a notable 62% rise over the same period. This comparison highlights the dynamic nature of cost management across industries. While United Airlines faced volatility, likely due to external factors like fuel prices and global events, Stanley Black & Decker's steadier growth reflects its strategic cost control. Understanding these trends offers valuable insights into the operational efficiencies of these industry giants.
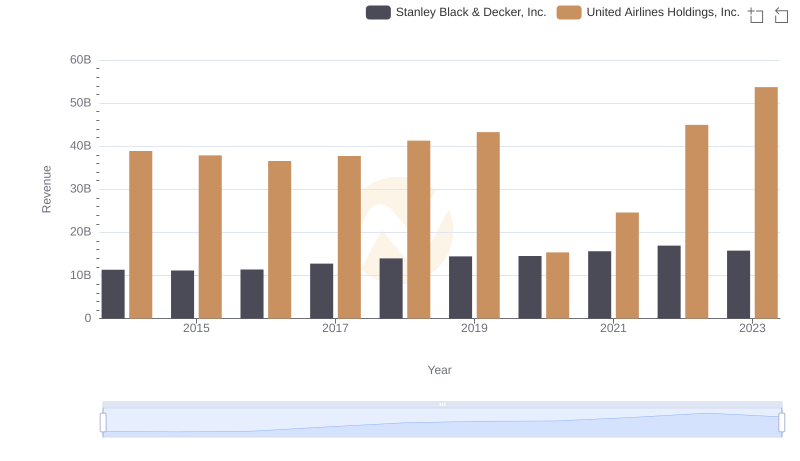
Breaking Down Revenue Trends: United Airlines Holdings, Inc. vs Stanley Black & Decker, Inc.
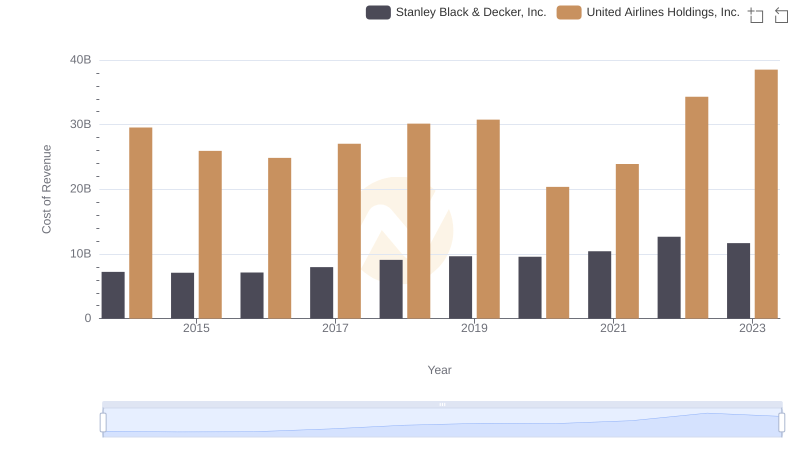
Comparing Cost of Revenue Efficiency: United Airlines Holdings, Inc. vs Stanley Black & Decker, Inc.
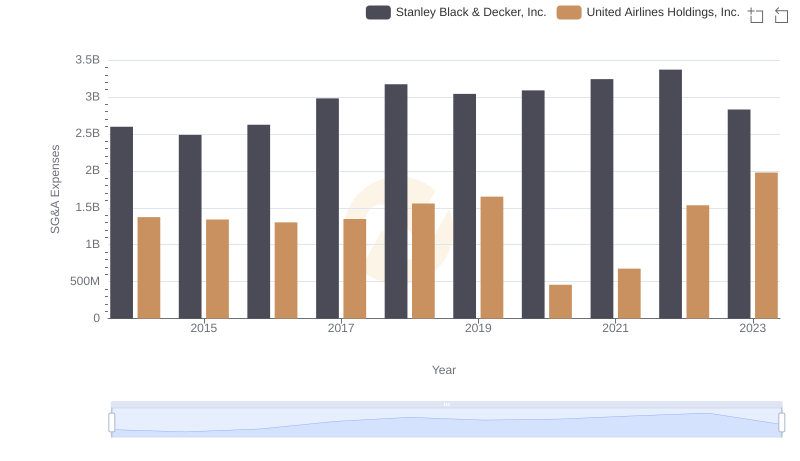
Cost Management Insights: SG&A Expenses for United Airlines Holdings, Inc. and Stanley Black & Decker, Inc.
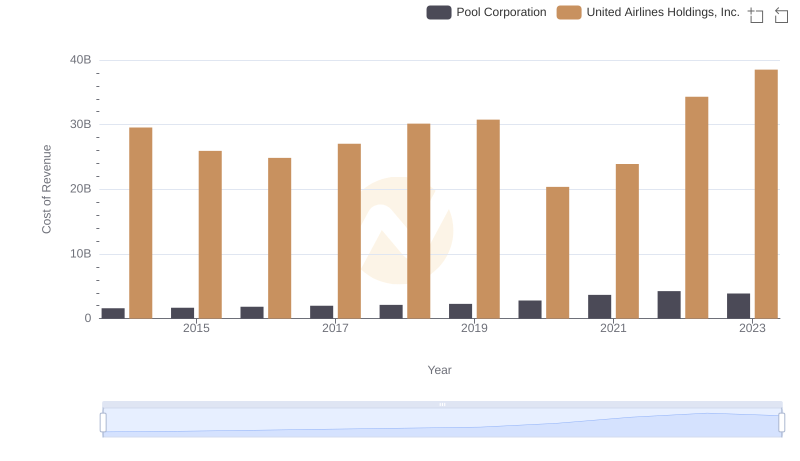
Cost Insights: Breaking Down United Airlines Holdings, Inc. and Pool Corporation's Expenses
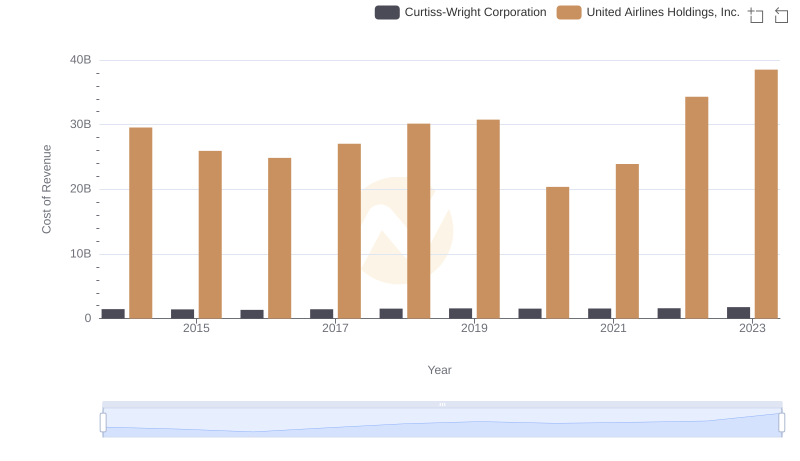
Cost of Revenue: Key Insights for United Airlines Holdings, Inc. and Curtiss-Wright Corporation
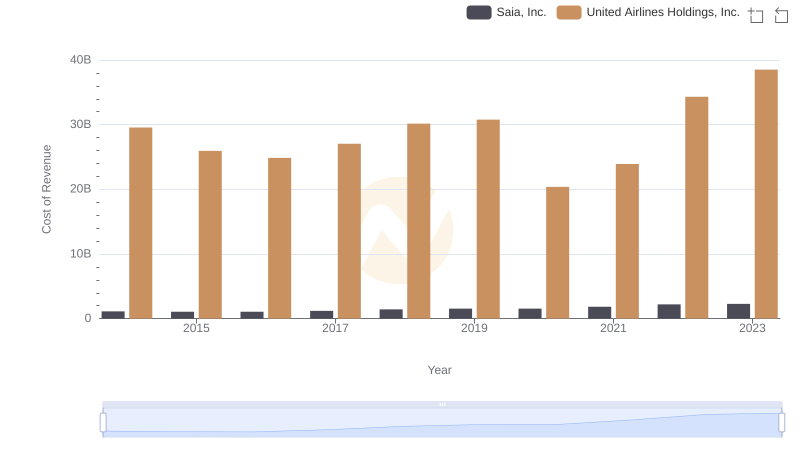
Comparing Cost of Revenue Efficiency: United Airlines Holdings, Inc. vs Saia, Inc.
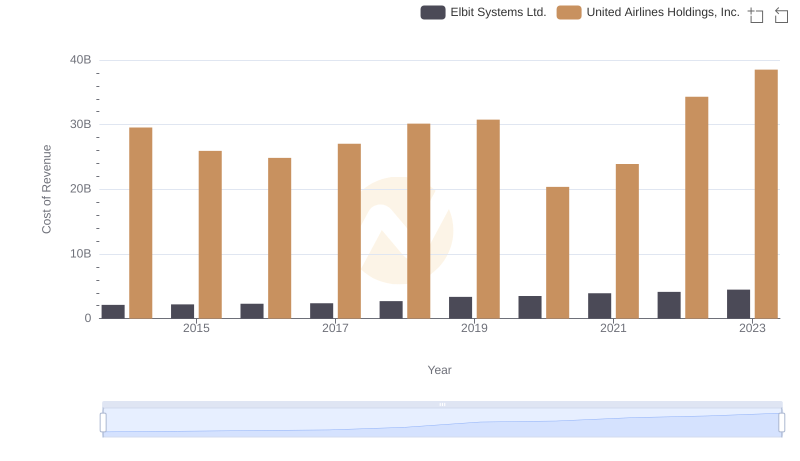
Cost Insights: Breaking Down United Airlines Holdings, Inc. and Elbit Systems Ltd.'s Expenses
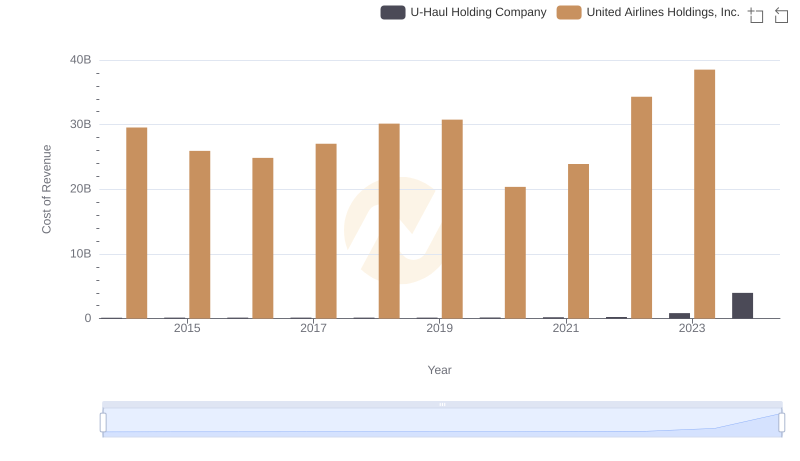
Cost of Revenue: Key Insights for United Airlines Holdings, Inc. and U-Haul Holding Company
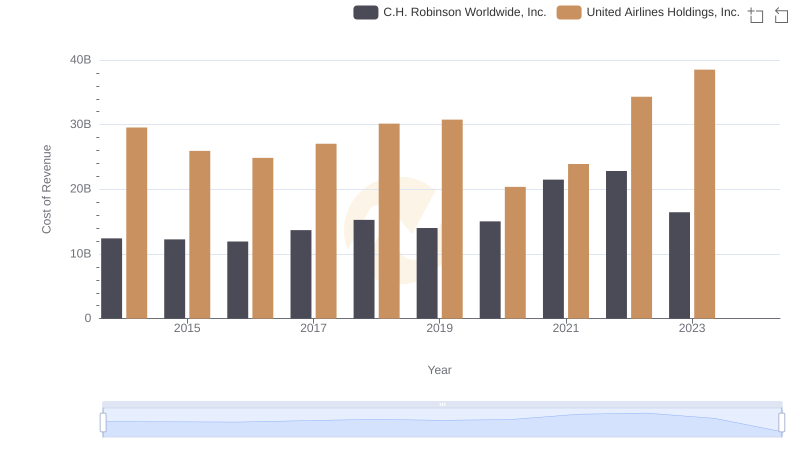
Cost of Revenue Comparison: United Airlines Holdings, Inc. vs C.H. Robinson Worldwide, Inc.
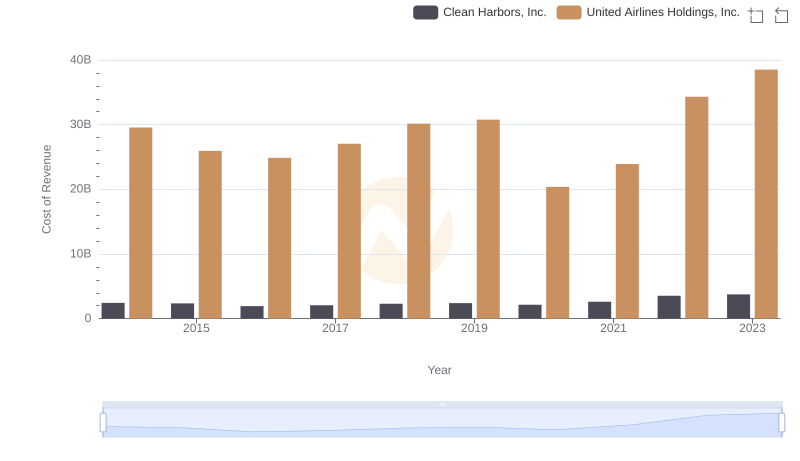
Cost Insights: Breaking Down United Airlines Holdings, Inc. and Clean Harbors, Inc.'s Expenses