| __timestamp | Rentokil Initial plc | United Airlines Holdings, Inc. |
|---|---|---|
| Wednesday, January 1, 2014 | 297500000 | 29569000000 |
| Thursday, January 1, 2015 | 310200000 | 25952000000 |
| Friday, January 1, 2016 | 376100000 | 24856000000 |
| Sunday, January 1, 2017 | 474900000 | 27056000000 |
| Monday, January 1, 2018 | 514200000 | 30165000000 |
| Tuesday, January 1, 2019 | 2099000000 | 30786000000 |
| Wednesday, January 1, 2020 | 2136400000 | 20385000000 |
| Friday, January 1, 2021 | 2239100000 | 23913000000 |
| Saturday, January 1, 2022 | 2737000000 | 34315000000 |
| Sunday, January 1, 2023 | 927000000 | 38518000000 |
| Monday, January 1, 2024 | 37643000000 |
Unlocking the unknown
In the world of business, efficiency is key, and the cost of revenue is a critical metric. This chart compares the cost of revenue efficiency between United Airlines Holdings, Inc. and Rentokil Initial plc from 2014 to 2023. United Airlines, a giant in the aviation industry, consistently shows a higher cost of revenue, peaking at approximately $38.5 billion in 2023. In contrast, Rentokil Initial, a leader in pest control, demonstrates a more modest cost of revenue, reaching around $2.7 billion in 2022.
Over the years, United Airlines' cost of revenue fluctuated, reflecting the volatile nature of the airline industry, especially during the pandemic in 2020. Rentokil Initial, however, maintained a steadier trajectory, with a significant increase in 2019 and 2020, possibly due to heightened demand for hygiene services. This comparison highlights the diverse challenges and efficiencies across different sectors.
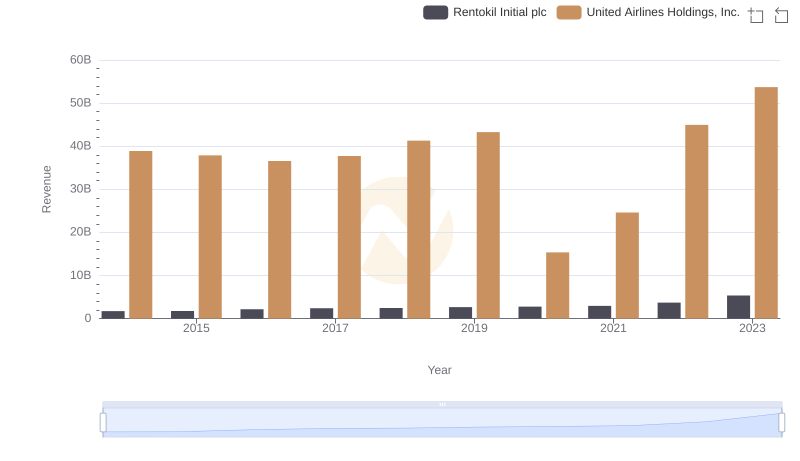
Who Generates More Revenue? United Airlines Holdings, Inc. or Rentokil Initial plc
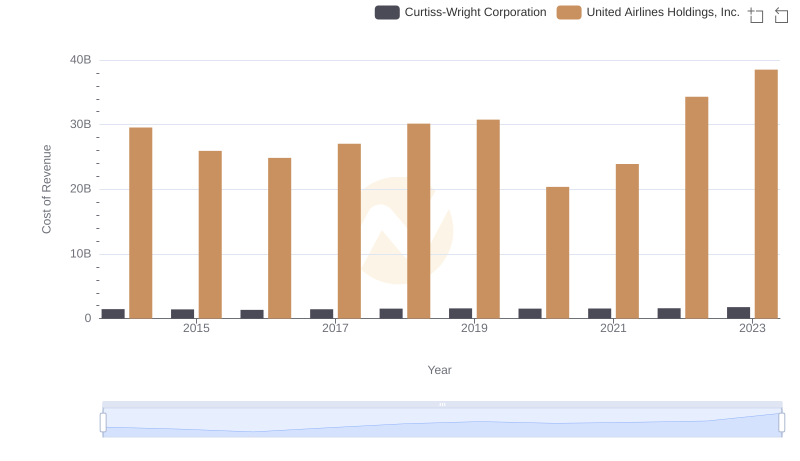
Cost of Revenue: Key Insights for United Airlines Holdings, Inc. and Curtiss-Wright Corporation
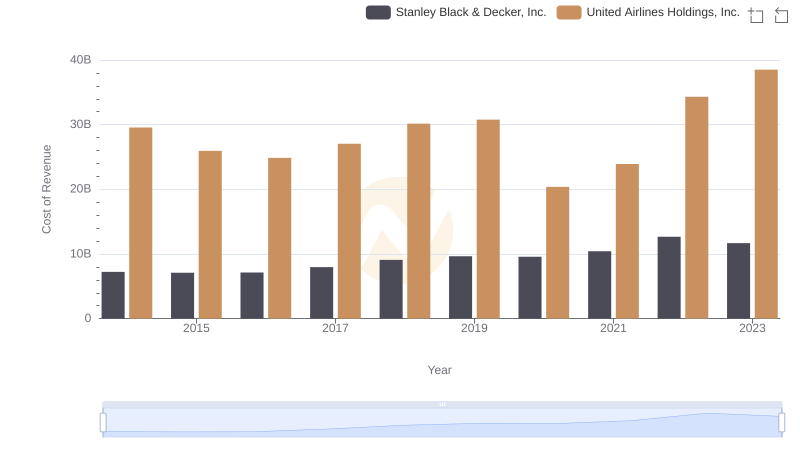
United Airlines Holdings, Inc. vs Stanley Black & Decker, Inc.: Efficiency in Cost of Revenue Explored
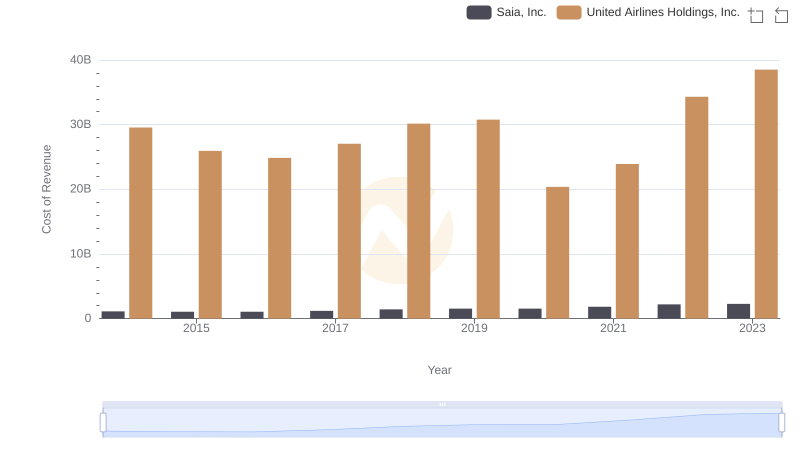
Comparing Cost of Revenue Efficiency: United Airlines Holdings, Inc. vs Saia, Inc.
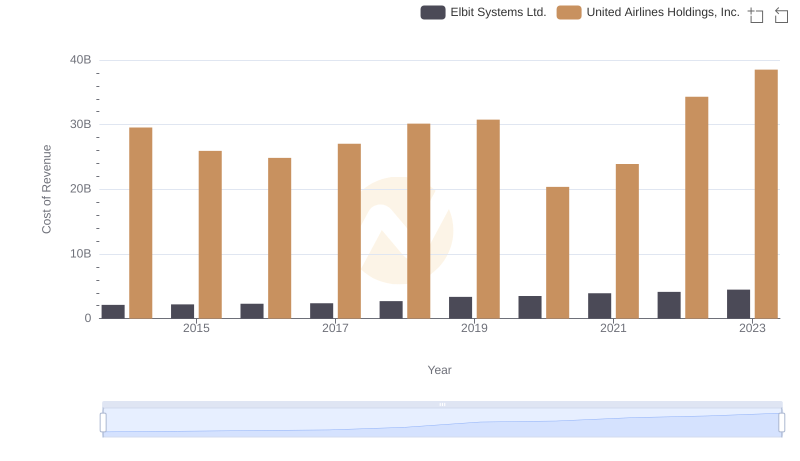
Cost Insights: Breaking Down United Airlines Holdings, Inc. and Elbit Systems Ltd.'s Expenses
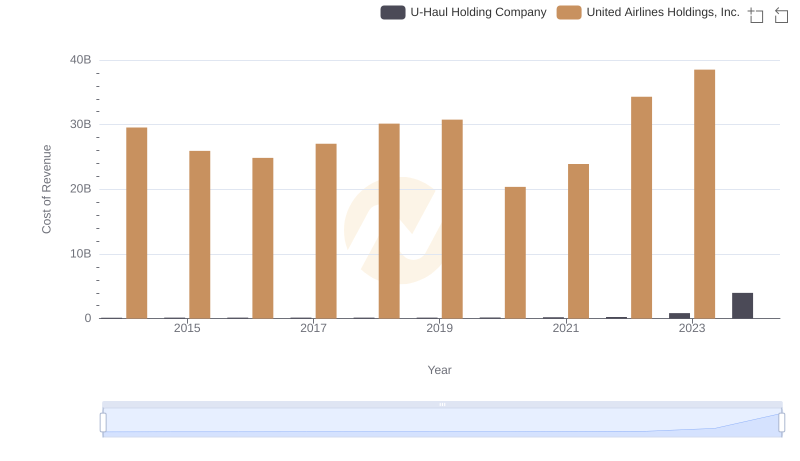
Cost of Revenue: Key Insights for United Airlines Holdings, Inc. and U-Haul Holding Company
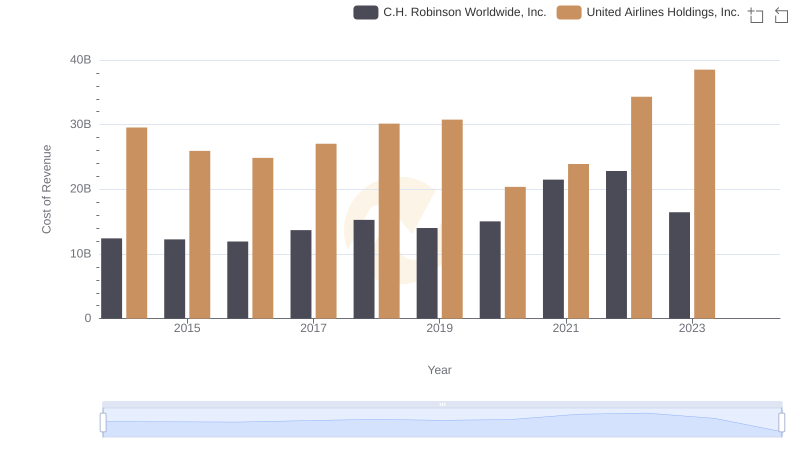
Cost of Revenue Comparison: United Airlines Holdings, Inc. vs C.H. Robinson Worldwide, Inc.
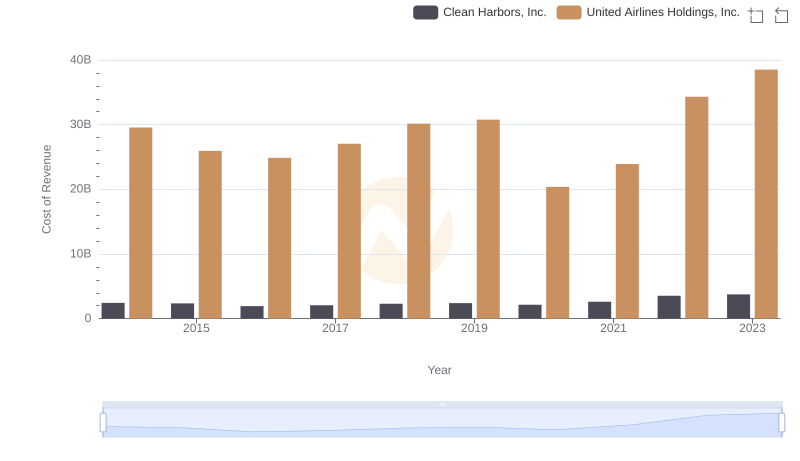
Cost Insights: Breaking Down United Airlines Holdings, Inc. and Clean Harbors, Inc.'s Expenses
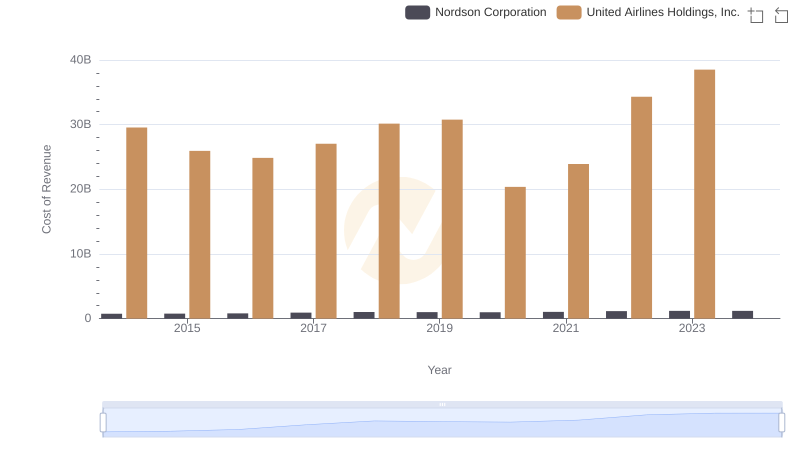
Comparing Cost of Revenue Efficiency: United Airlines Holdings, Inc. vs Nordson Corporation
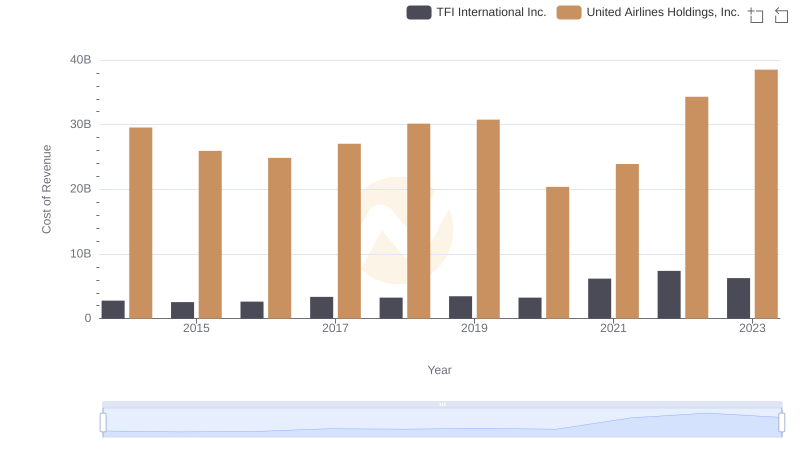
Cost of Revenue Comparison: United Airlines Holdings, Inc. vs TFI International Inc.
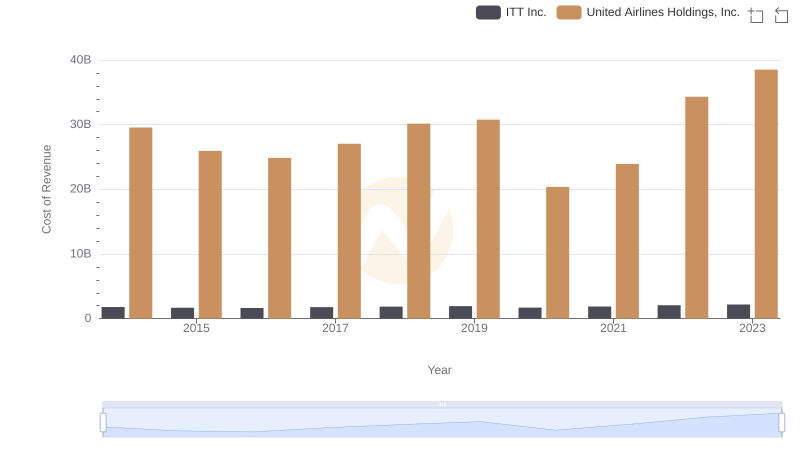
Analyzing Cost of Revenue: United Airlines Holdings, Inc. and ITT Inc.