| __timestamp | Clean Harbors, Inc. | United Airlines Holdings, Inc. |
|---|---|---|
| Wednesday, January 1, 2014 | 2441796000 | 29569000000 |
| Thursday, January 1, 2015 | 2356806000 | 25952000000 |
| Friday, January 1, 2016 | 1932857000 | 24856000000 |
| Sunday, January 1, 2017 | 2062673000 | 27056000000 |
| Monday, January 1, 2018 | 2305551000 | 30165000000 |
| Tuesday, January 1, 2019 | 2387819000 | 30786000000 |
| Wednesday, January 1, 2020 | 2137751000 | 20385000000 |
| Friday, January 1, 2021 | 2609837000 | 23913000000 |
| Saturday, January 1, 2022 | 3543930000 | 34315000000 |
| Sunday, January 1, 2023 | 3746124000 | 38518000000 |
| Monday, January 1, 2024 | 4065713000 | 37643000000 |
Igniting the spark of knowledge
In the ever-evolving landscape of corporate expenses, understanding cost structures is crucial. This analysis delves into the cost of revenue trends for United Airlines Holdings, Inc. and Clean Harbors, Inc. from 2014 to 2023. Over this period, United Airlines consistently reported higher costs, peaking in 2023 with a 30% increase from its 2020 low. Meanwhile, Clean Harbors demonstrated a steady growth trajectory, culminating in a 94% rise in 2023 compared to 2016. This divergence highlights the distinct operational challenges faced by an airline versus an environmental services company. United Airlines' costs reflect the volatile nature of the aviation industry, impacted by global events and fuel prices. In contrast, Clean Harbors' gradual increase underscores its strategic expansion and adaptation to environmental regulations. This comparative insight offers a window into the financial dynamics shaping these two industry leaders.
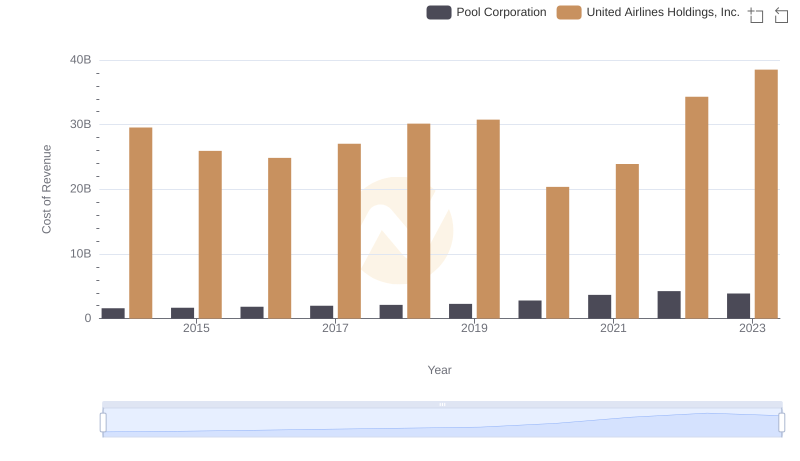
Cost Insights: Breaking Down United Airlines Holdings, Inc. and Pool Corporation's Expenses
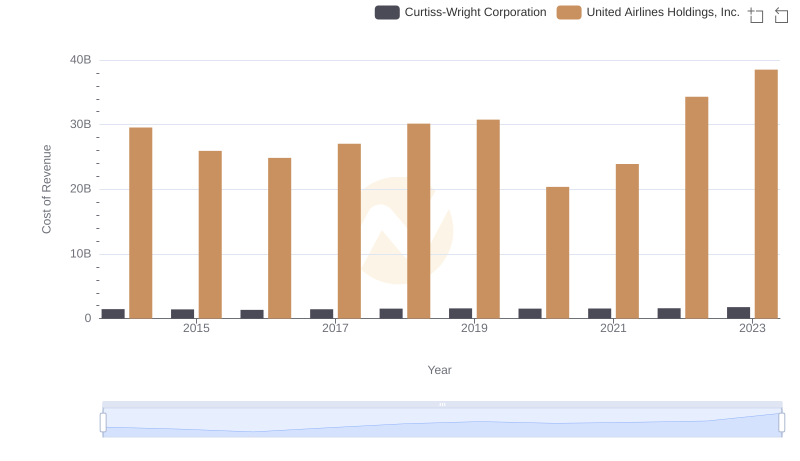
Cost of Revenue: Key Insights for United Airlines Holdings, Inc. and Curtiss-Wright Corporation
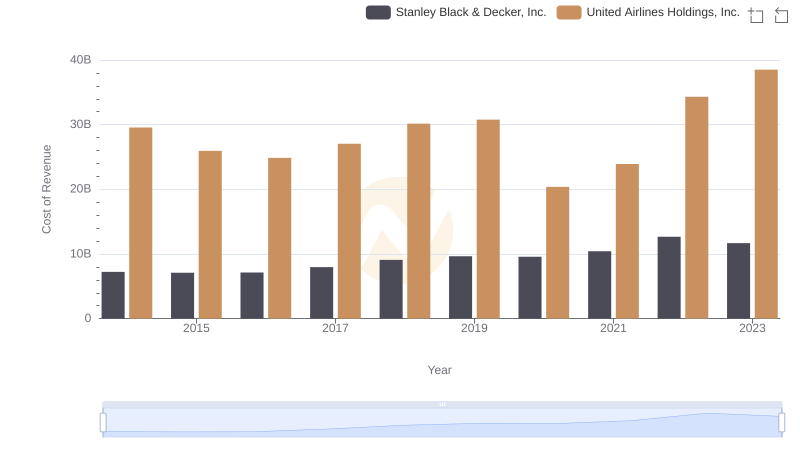
United Airlines Holdings, Inc. vs Stanley Black & Decker, Inc.: Efficiency in Cost of Revenue Explored
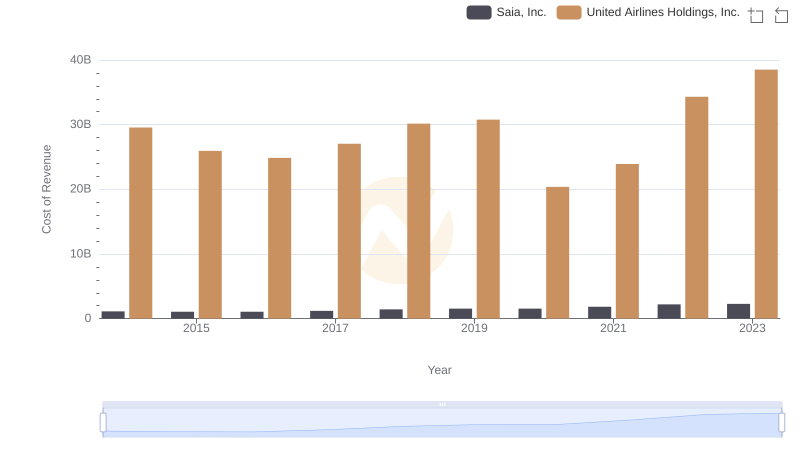
Comparing Cost of Revenue Efficiency: United Airlines Holdings, Inc. vs Saia, Inc.
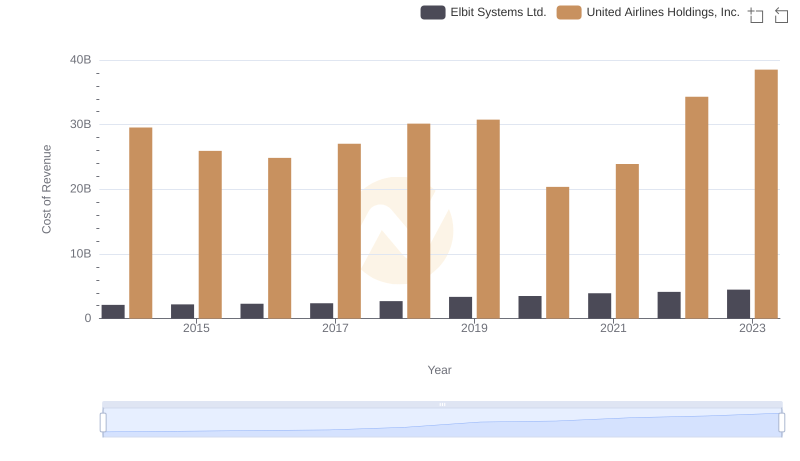
Cost Insights: Breaking Down United Airlines Holdings, Inc. and Elbit Systems Ltd.'s Expenses
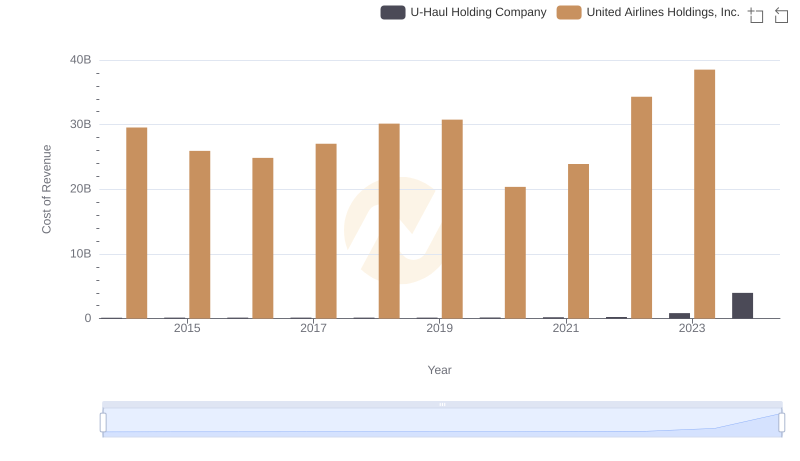
Cost of Revenue: Key Insights for United Airlines Holdings, Inc. and U-Haul Holding Company
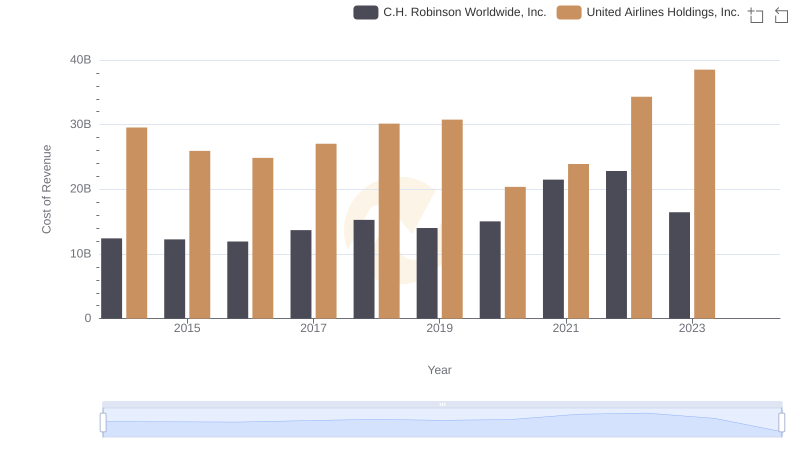
Cost of Revenue Comparison: United Airlines Holdings, Inc. vs C.H. Robinson Worldwide, Inc.
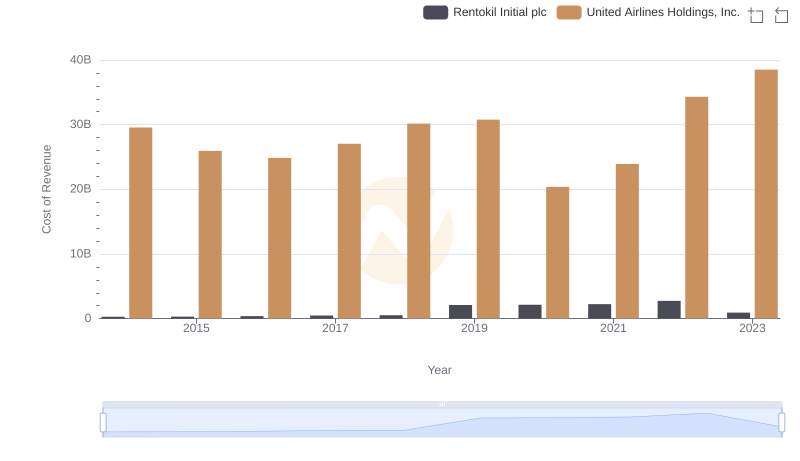
Comparing Cost of Revenue Efficiency: United Airlines Holdings, Inc. vs Rentokil Initial plc
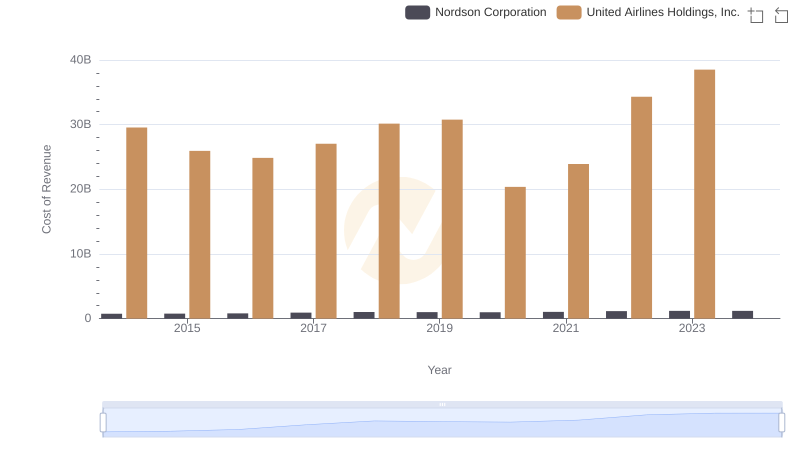
Comparing Cost of Revenue Efficiency: United Airlines Holdings, Inc. vs Nordson Corporation
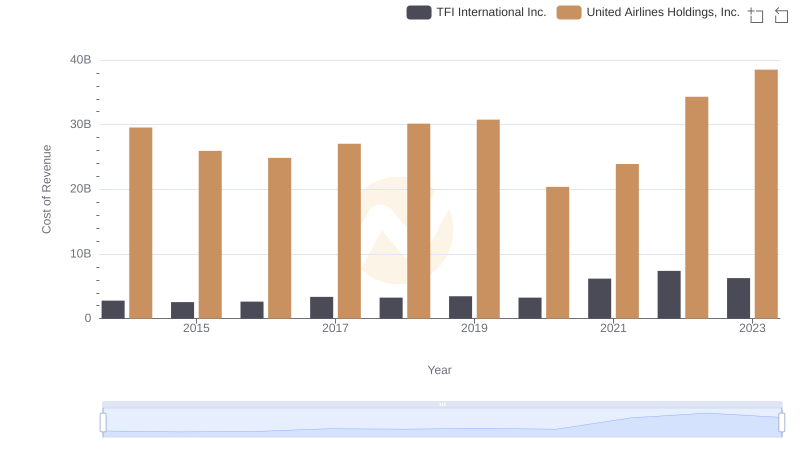
Cost of Revenue Comparison: United Airlines Holdings, Inc. vs TFI International Inc.