| __timestamp | TFI International Inc. | United Airlines Holdings, Inc. |
|---|---|---|
| Wednesday, January 1, 2014 | 2782605137 | 29569000000 |
| Thursday, January 1, 2015 | 2551474032 | 25952000000 |
| Friday, January 1, 2016 | 2636493564 | 24856000000 |
| Sunday, January 1, 2017 | 3364979721 | 27056000000 |
| Monday, January 1, 2018 | 3251443800 | 30165000000 |
| Tuesday, January 1, 2019 | 3461987950 | 30786000000 |
| Wednesday, January 1, 2020 | 3239249000 | 20385000000 |
| Friday, January 1, 2021 | 6182566000 | 23913000000 |
| Saturday, January 1, 2022 | 7385640000 | 34315000000 |
| Sunday, January 1, 2023 | 6255775000 | 38518000000 |
| Monday, January 1, 2024 | 37643000000 |
Unveiling the hidden dimensions of data
In the ever-evolving landscape of the transportation industry, United Airlines Holdings, Inc. and TFI International Inc. stand as titans, each with a unique trajectory in cost management. Over the past decade, United Airlines has consistently maintained a higher cost of revenue, peaking in 2023 with a staggering 38.5 billion dollars. This represents a 30% increase from its 2020 low, reflecting the airline's recovery and expansion post-pandemic.
Conversely, TFI International Inc. has demonstrated a more dynamic growth pattern. From 2014 to 2023, TFI's cost of revenue surged by approximately 125%, reaching 7.4 billion dollars in 2022. This growth underscores TFI's strategic acquisitions and expansion in the logistics sector.
The data reveals a compelling narrative of resilience and adaptation, highlighting the contrasting strategies of these industry leaders in navigating economic challenges and opportunities.
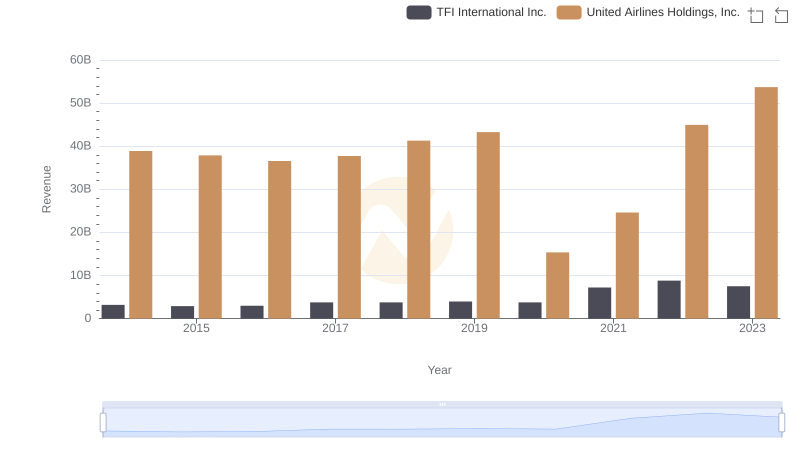
Who Generates More Revenue? United Airlines Holdings, Inc. or TFI International Inc.
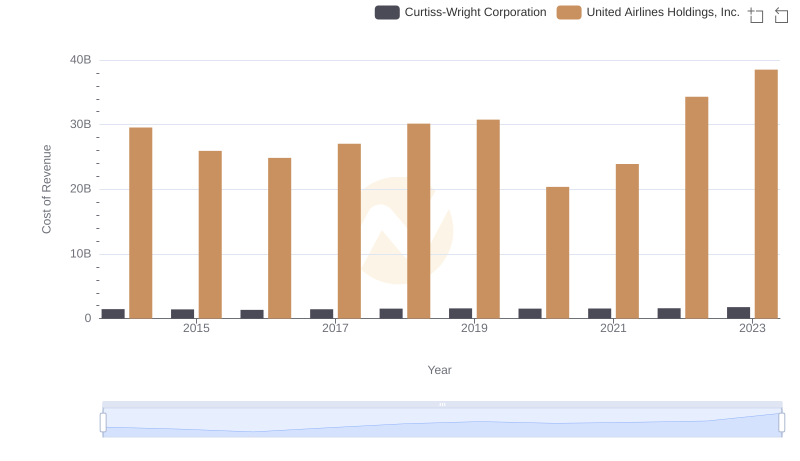
Cost of Revenue: Key Insights for United Airlines Holdings, Inc. and Curtiss-Wright Corporation
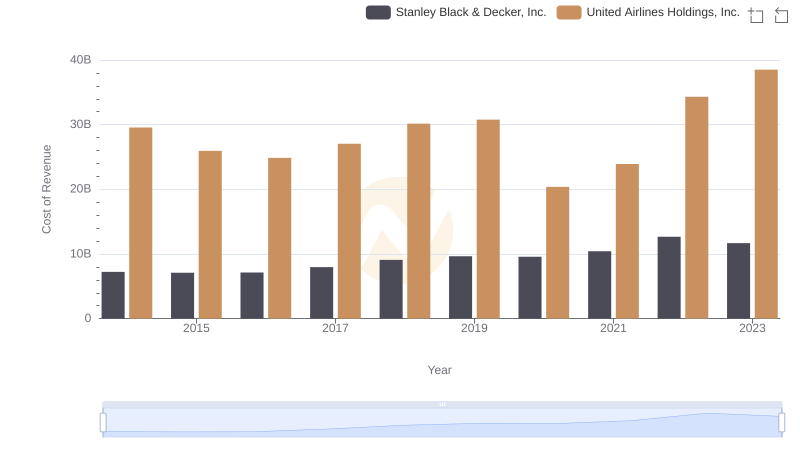
United Airlines Holdings, Inc. vs Stanley Black & Decker, Inc.: Efficiency in Cost of Revenue Explored

Comparing Cost of Revenue Efficiency: United Airlines Holdings, Inc. vs Saia, Inc.
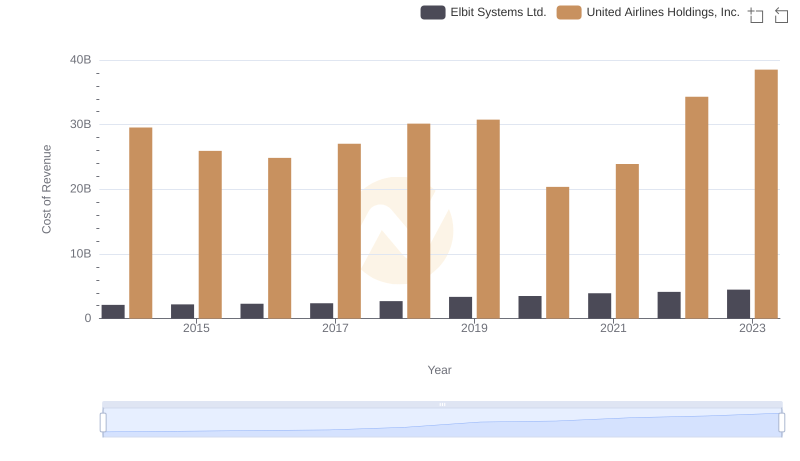
Cost Insights: Breaking Down United Airlines Holdings, Inc. and Elbit Systems Ltd.'s Expenses
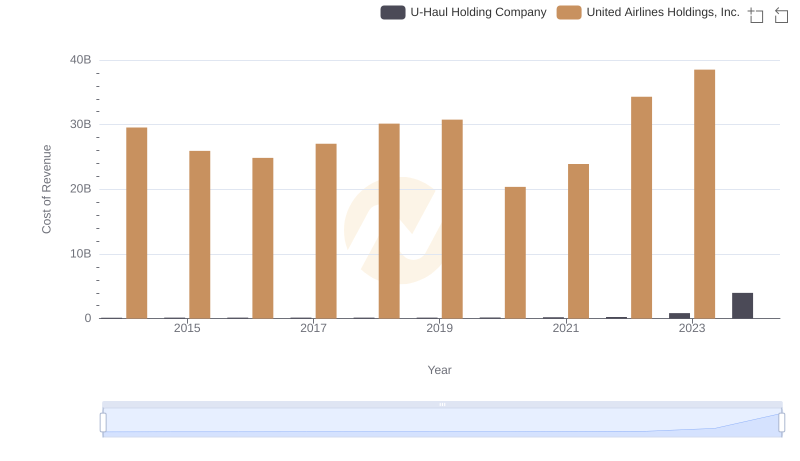
Cost of Revenue: Key Insights for United Airlines Holdings, Inc. and U-Haul Holding Company
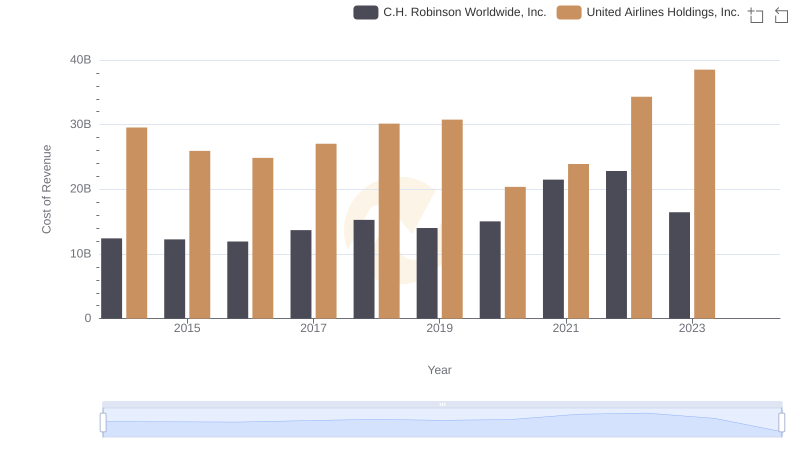
Cost of Revenue Comparison: United Airlines Holdings, Inc. vs C.H. Robinson Worldwide, Inc.
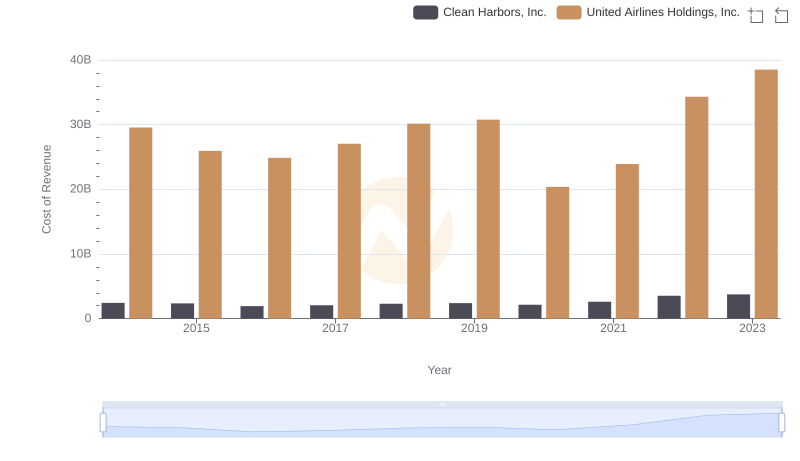
Cost Insights: Breaking Down United Airlines Holdings, Inc. and Clean Harbors, Inc.'s Expenses
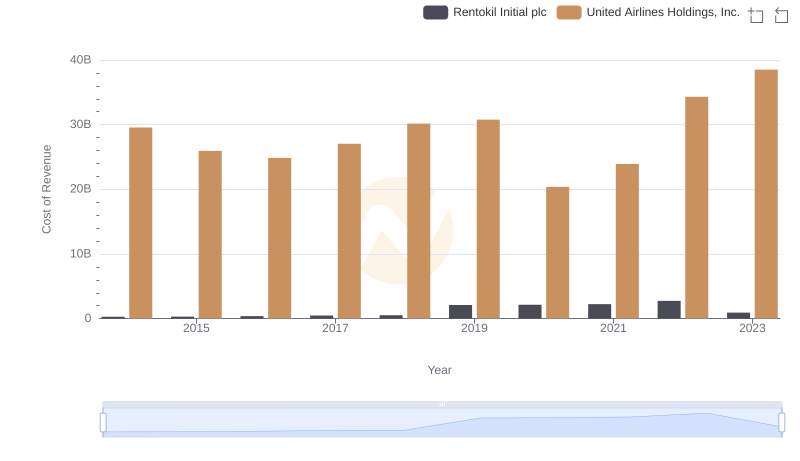
Comparing Cost of Revenue Efficiency: United Airlines Holdings, Inc. vs Rentokil Initial plc
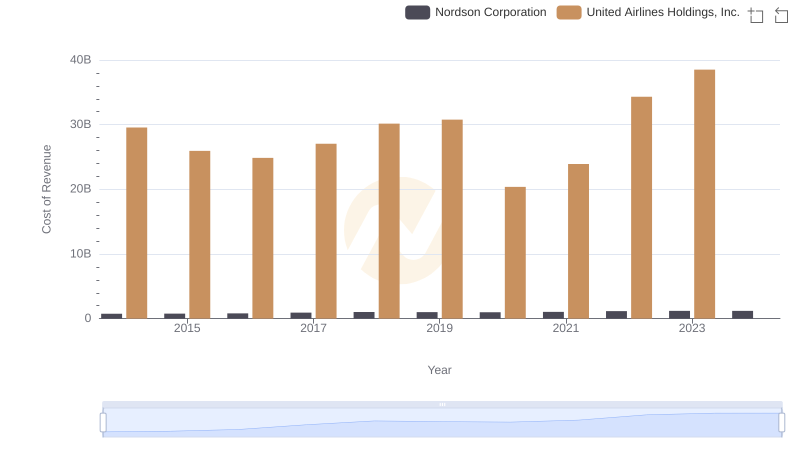
Comparing Cost of Revenue Efficiency: United Airlines Holdings, Inc. vs Nordson Corporation
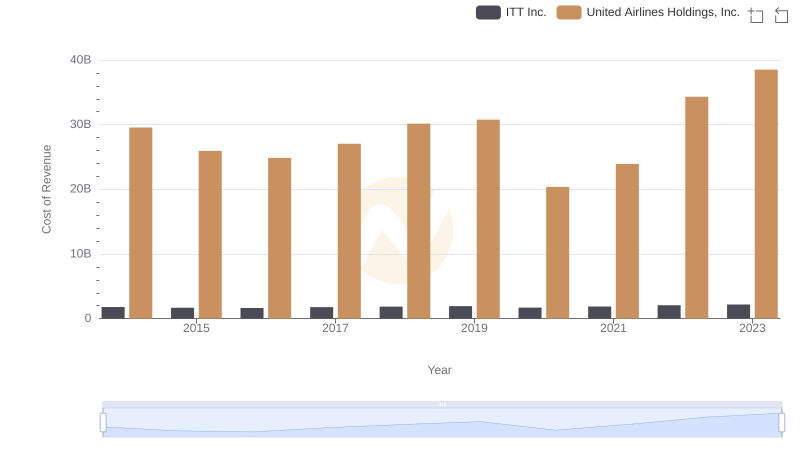
Analyzing Cost of Revenue: United Airlines Holdings, Inc. and ITT Inc.
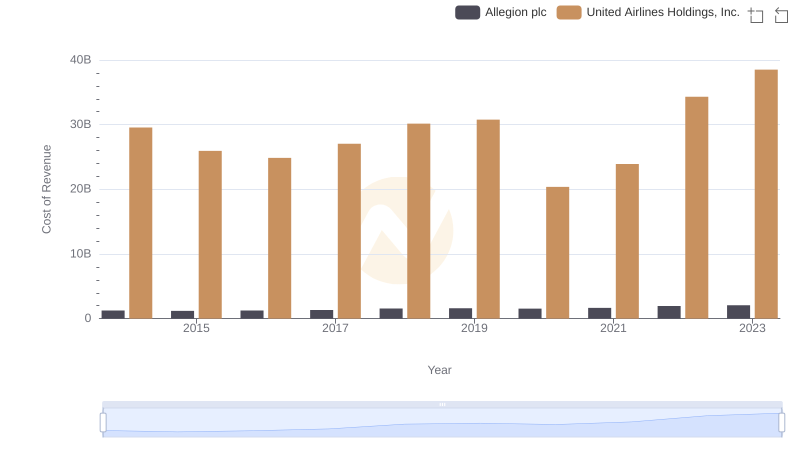
Comparing Cost of Revenue Efficiency: United Airlines Holdings, Inc. vs Allegion plc