| __timestamp | Nordson Corporation | United Airlines Holdings, Inc. |
|---|---|---|
| Wednesday, January 1, 2014 | 758923000 | 29569000000 |
| Thursday, January 1, 2015 | 774702000 | 25952000000 |
| Friday, January 1, 2016 | 815495000 | 24856000000 |
| Sunday, January 1, 2017 | 927981000 | 27056000000 |
| Monday, January 1, 2018 | 1018703000 | 30165000000 |
| Tuesday, January 1, 2019 | 1002123000 | 30786000000 |
| Wednesday, January 1, 2020 | 990632000 | 20385000000 |
| Friday, January 1, 2021 | 1038129000 | 23913000000 |
| Saturday, January 1, 2022 | 1163742000 | 34315000000 |
| Sunday, January 1, 2023 | 1203227000 | 38518000000 |
| Monday, January 1, 2024 | 1203792000 | 37643000000 |
Unveiling the hidden dimensions of data
In the ever-evolving landscape of corporate finance, understanding cost efficiency is paramount. This analysis juxtaposes the cost of revenue efficiency between United Airlines Holdings, Inc. and Nordson Corporation from 2014 to 2023. United Airlines, a titan in the aviation industry, consistently reported a cost of revenue that dwarfed Nordson's by over 3,000%. However, Nordson, a leader in precision technology, demonstrated a steady growth trajectory, increasing its cost of revenue by approximately 58% over the decade.
While United Airlines faced fluctuations, particularly during the pandemic in 2020, Nordson's cost efficiency remained resilient, reflecting its robust business model. The data for 2024 is incomplete, highlighting the dynamic nature of financial forecasting. This comparison underscores the diverse challenges and strategies across industries, offering a fascinating glimpse into how companies navigate their financial landscapes.
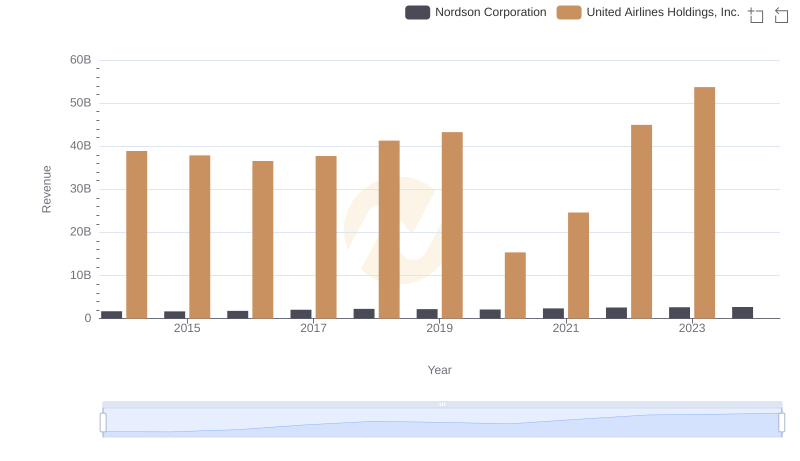
Revenue Insights: United Airlines Holdings, Inc. and Nordson Corporation Performance Compared
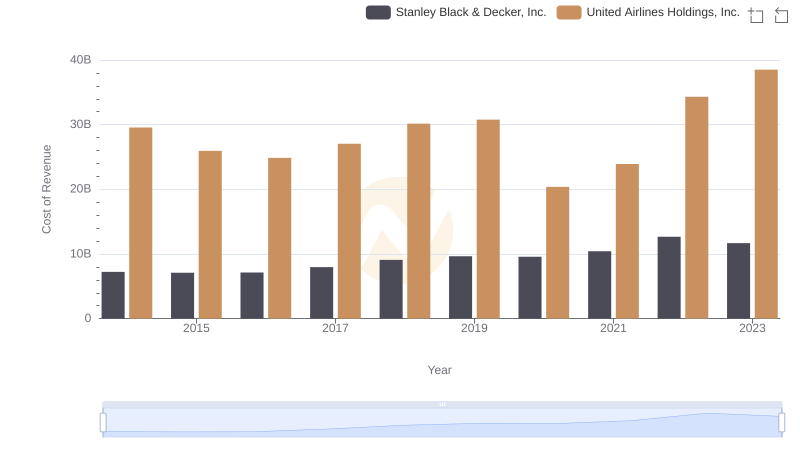
United Airlines Holdings, Inc. vs Stanley Black & Decker, Inc.: Efficiency in Cost of Revenue Explored

Comparing Cost of Revenue Efficiency: United Airlines Holdings, Inc. vs Saia, Inc.
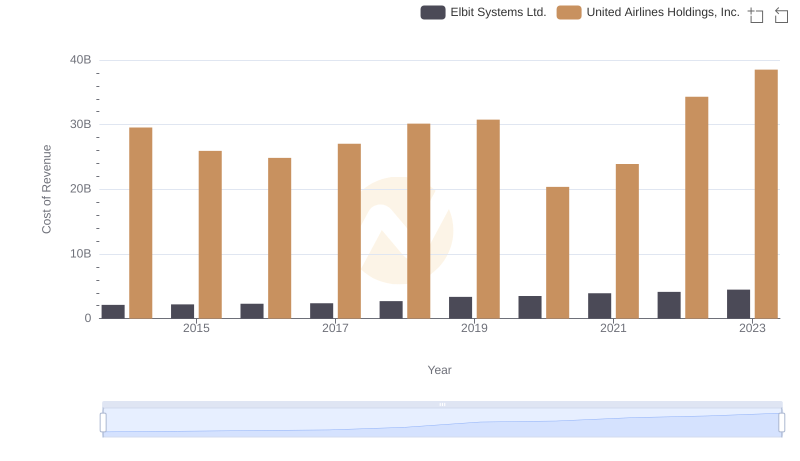
Cost Insights: Breaking Down United Airlines Holdings, Inc. and Elbit Systems Ltd.'s Expenses
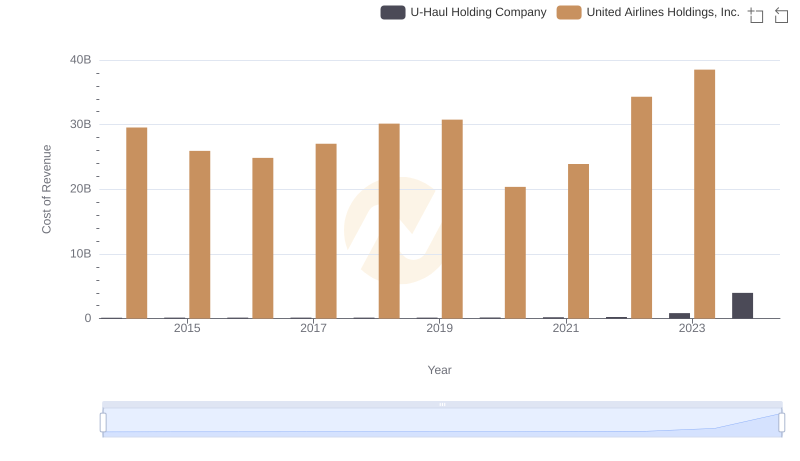
Cost of Revenue: Key Insights for United Airlines Holdings, Inc. and U-Haul Holding Company
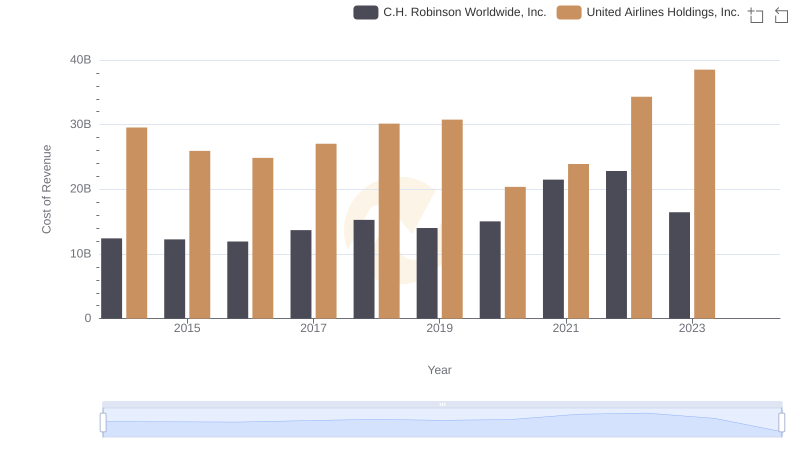
Cost of Revenue Comparison: United Airlines Holdings, Inc. vs C.H. Robinson Worldwide, Inc.
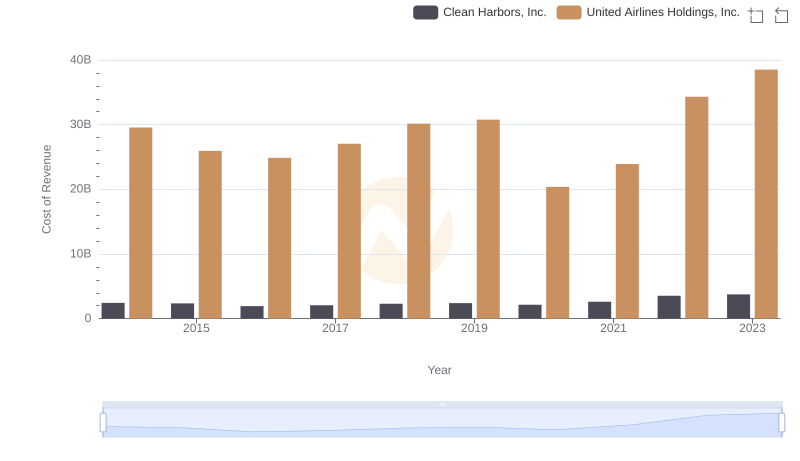
Cost Insights: Breaking Down United Airlines Holdings, Inc. and Clean Harbors, Inc.'s Expenses
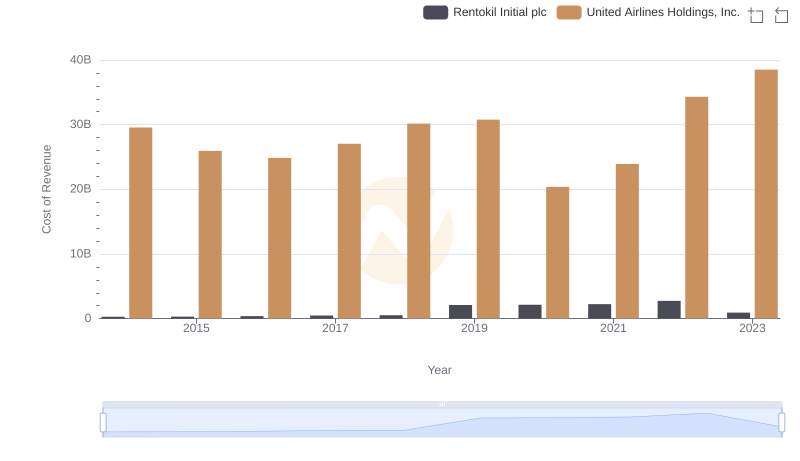
Comparing Cost of Revenue Efficiency: United Airlines Holdings, Inc. vs Rentokil Initial plc
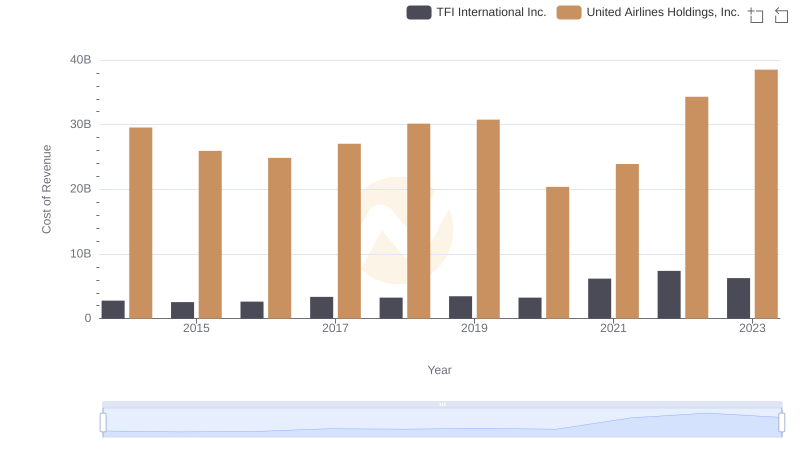
Cost of Revenue Comparison: United Airlines Holdings, Inc. vs TFI International Inc.
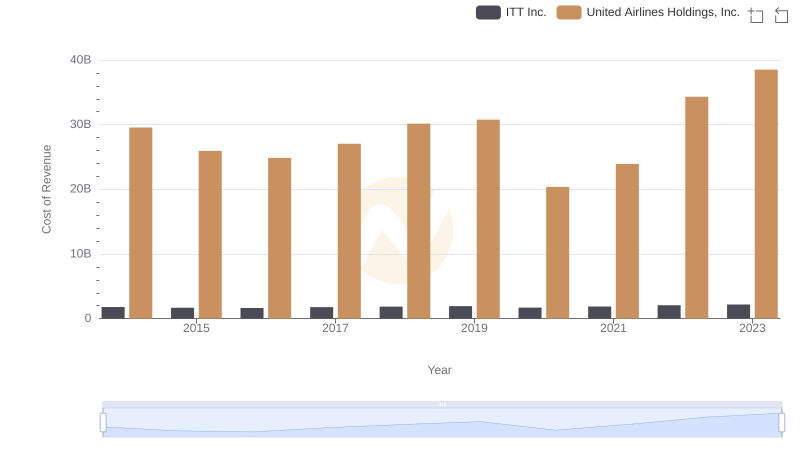
Analyzing Cost of Revenue: United Airlines Holdings, Inc. and ITT Inc.
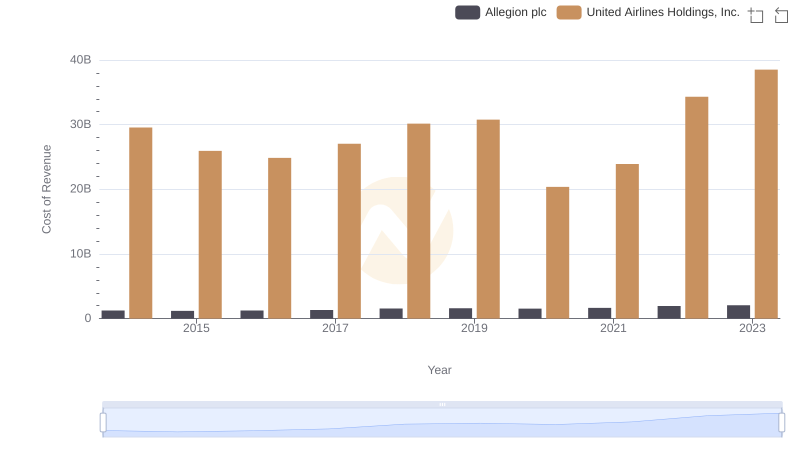
Comparing Cost of Revenue Efficiency: United Airlines Holdings, Inc. vs Allegion plc