| __timestamp | Emerson Electric Co. | Trane Technologies plc |
|---|---|---|
| Wednesday, January 1, 2014 | 14379000000 | 8982800000 |
| Thursday, January 1, 2015 | 13256000000 | 9301600000 |
| Friday, January 1, 2016 | 8260000000 | 9329300000 |
| Sunday, January 1, 2017 | 8860000000 | 9811600000 |
| Monday, January 1, 2018 | 9948000000 | 10847600000 |
| Tuesday, January 1, 2019 | 10557000000 | 11451500000 |
| Wednesday, January 1, 2020 | 9776000000 | 8651300000 |
| Friday, January 1, 2021 | 10673000000 | 9666800000 |
| Saturday, January 1, 2022 | 11441000000 | 11026900000 |
| Sunday, January 1, 2023 | 7738000000 | 11820400000 |
| Monday, January 1, 2024 | 9684000000 | 12757700000 |
Igniting the spark of knowledge
In the ever-evolving industrial sector, understanding cost structures is crucial for strategic decision-making. Over the past decade, Trane Technologies plc and Emerson Electric Co. have showcased intriguing trends in their cost of revenue. From 2014 to 2023, Emerson Electric's cost of revenue fluctuated significantly, peaking in 2014 and 2015, before experiencing a notable dip in 2023. In contrast, Trane Technologies demonstrated a more consistent upward trajectory, culminating in a 32% increase from 2014 to 2023. This divergence highlights Trane's strategic cost management and market adaptation. Notably, 2023 data for Trane Technologies is missing, leaving room for speculation on its financial strategies. As these industrial giants navigate economic shifts, their cost management strategies will be pivotal in maintaining competitive edges.
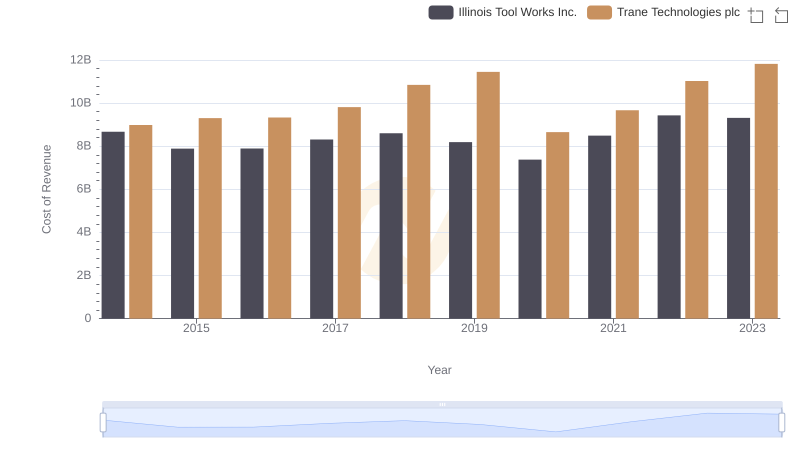
Trane Technologies plc vs Illinois Tool Works Inc.: Efficiency in Cost of Revenue Explored
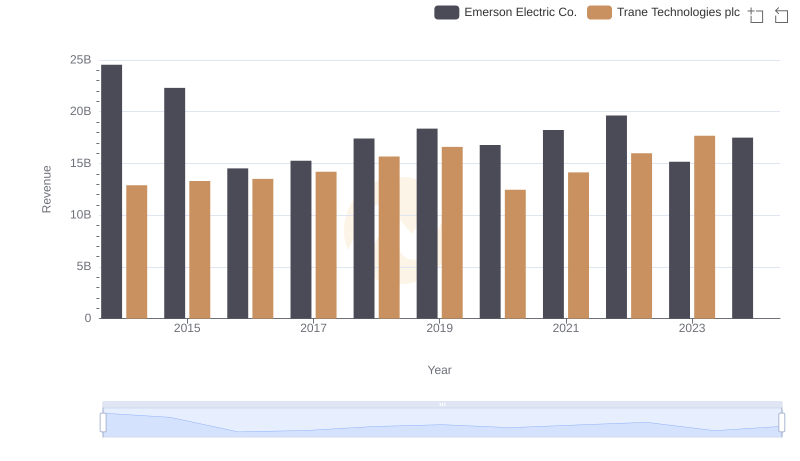
Revenue Insights: Trane Technologies plc and Emerson Electric Co. Performance Compared
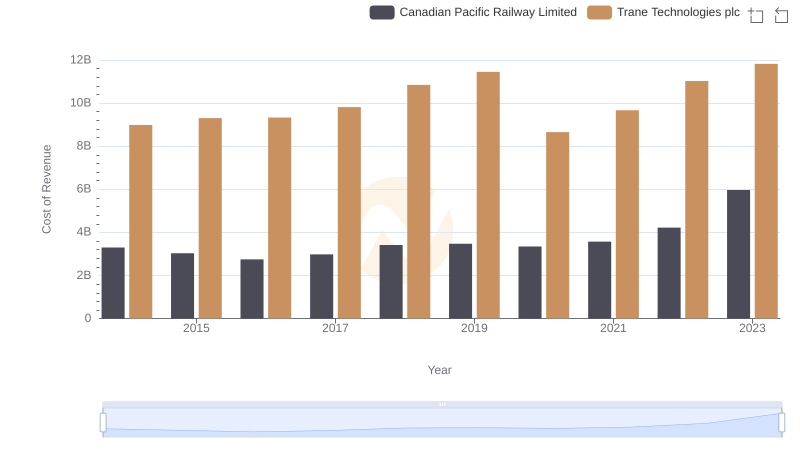
Trane Technologies plc vs Canadian Pacific Railway Limited: Efficiency in Cost of Revenue Explored
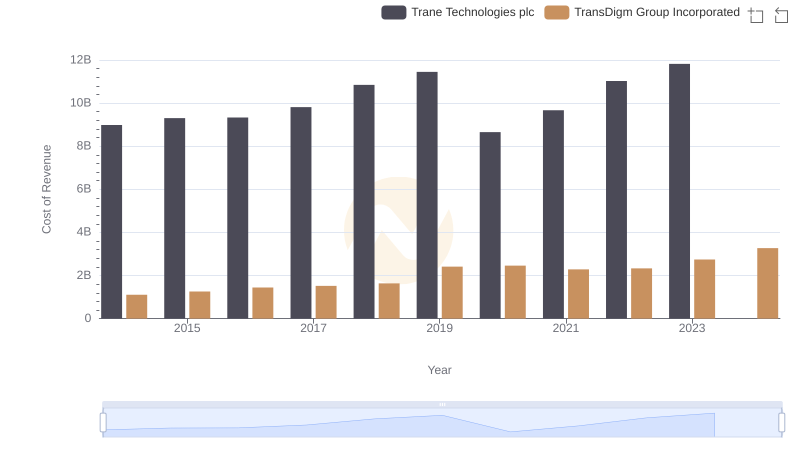
Comparing Cost of Revenue Efficiency: Trane Technologies plc vs TransDigm Group Incorporated
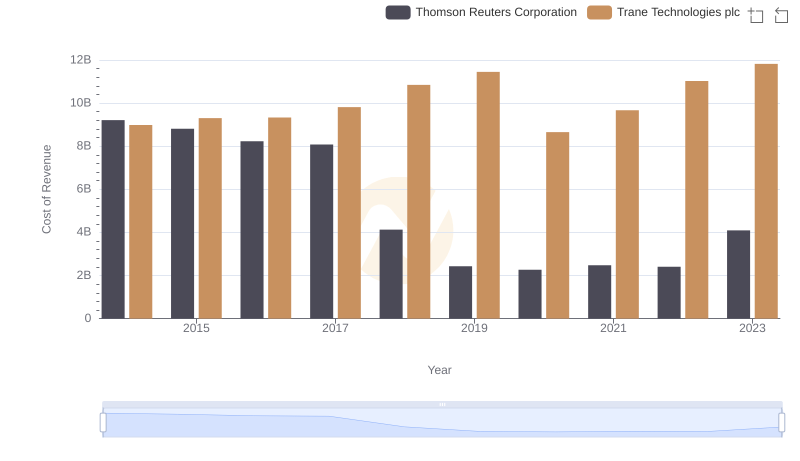
Cost of Revenue Comparison: Trane Technologies plc vs Thomson Reuters Corporation
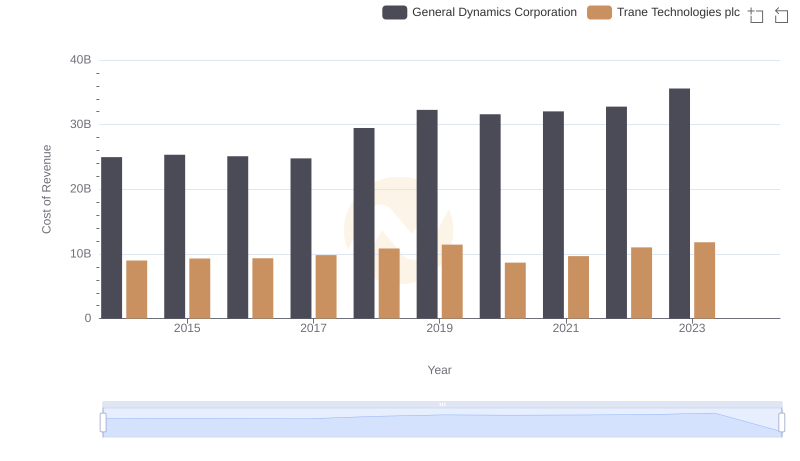
Cost of Revenue Trends: Trane Technologies plc vs General Dynamics Corporation
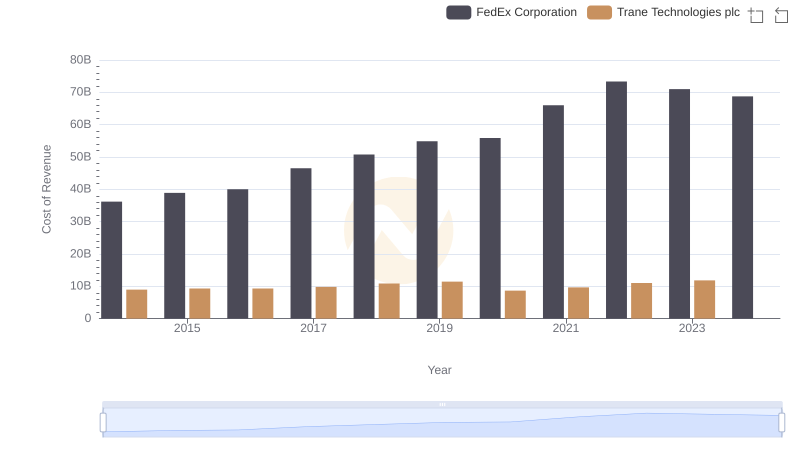
Cost of Revenue Trends: Trane Technologies plc vs FedEx Corporation
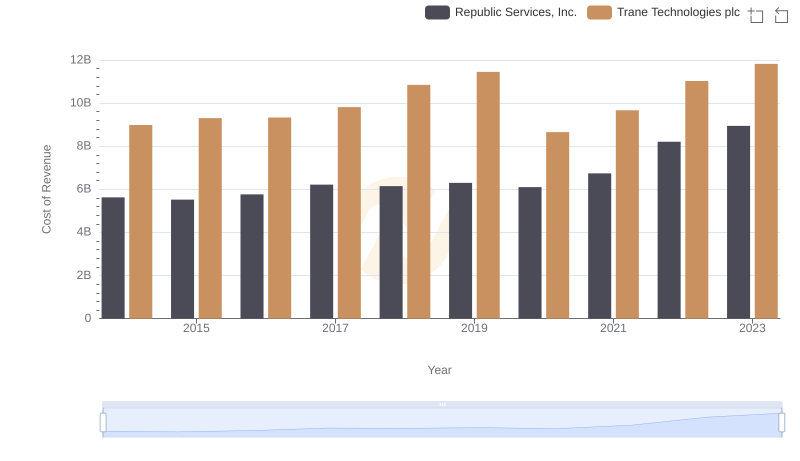
Analyzing Cost of Revenue: Trane Technologies plc and Republic Services, Inc.
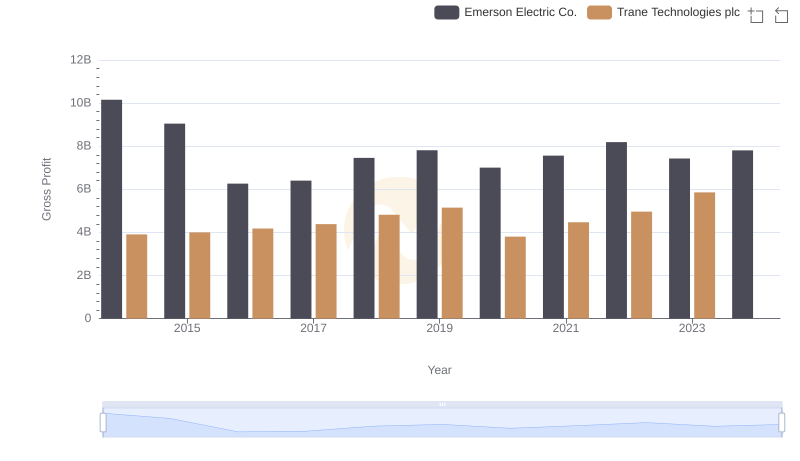
Gross Profit Trends Compared: Trane Technologies plc vs Emerson Electric Co.
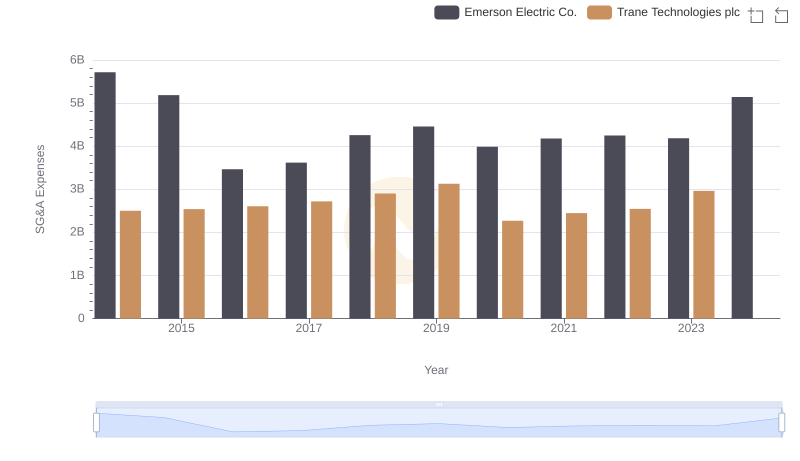
Operational Costs Compared: SG&A Analysis of Trane Technologies plc and Emerson Electric Co.
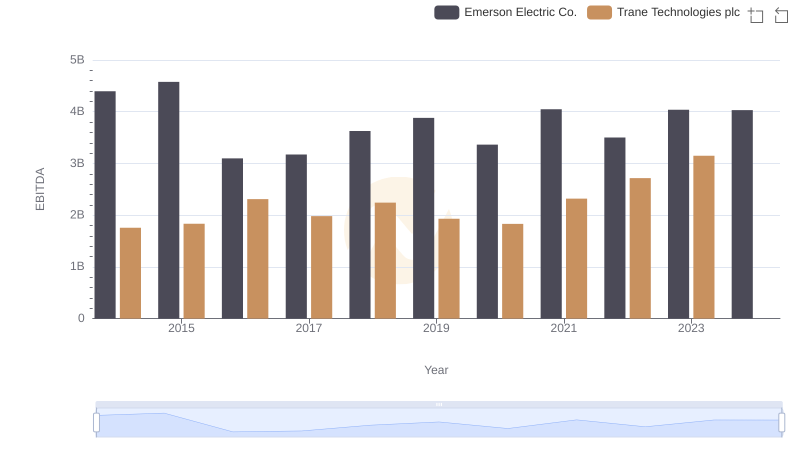
Comparative EBITDA Analysis: Trane Technologies plc vs Emerson Electric Co.