| __timestamp | Illinois Tool Works Inc. | Trane Technologies plc |
|---|---|---|
| Wednesday, January 1, 2014 | 8673000000 | 8982800000 |
| Thursday, January 1, 2015 | 7888000000 | 9301600000 |
| Friday, January 1, 2016 | 7896000000 | 9329300000 |
| Sunday, January 1, 2017 | 8309000000 | 9811600000 |
| Monday, January 1, 2018 | 8604000000 | 10847600000 |
| Tuesday, January 1, 2019 | 8187000000 | 11451500000 |
| Wednesday, January 1, 2020 | 7375000000 | 8651300000 |
| Friday, January 1, 2021 | 8489000000 | 9666800000 |
| Saturday, January 1, 2022 | 9429000000 | 11026900000 |
| Sunday, January 1, 2023 | 9316000000 | 11820400000 |
| Monday, January 1, 2024 | 8858000000 | 12757700000 |
Data in motion
In the competitive landscape of industrial manufacturing, cost efficiency is a critical metric. Over the past decade, Trane Technologies plc and Illinois Tool Works Inc. have demonstrated distinct trends in their cost of revenue. From 2014 to 2023, Trane Technologies consistently outpaced Illinois Tool Works, with an average cost of revenue approximately 20% higher. Notably, in 2023, Trane Technologies reached a peak, with costs rising to 11.8 billion, marking a 32% increase from 2014. Meanwhile, Illinois Tool Works showed a more stable trajectory, peaking in 2022 with a 9% increase from its 2014 figures. This data highlights Trane Technologies' aggressive growth strategy, while Illinois Tool Works maintains a steady, controlled approach. Understanding these trends provides valuable insights into each company's operational strategies and market positioning.
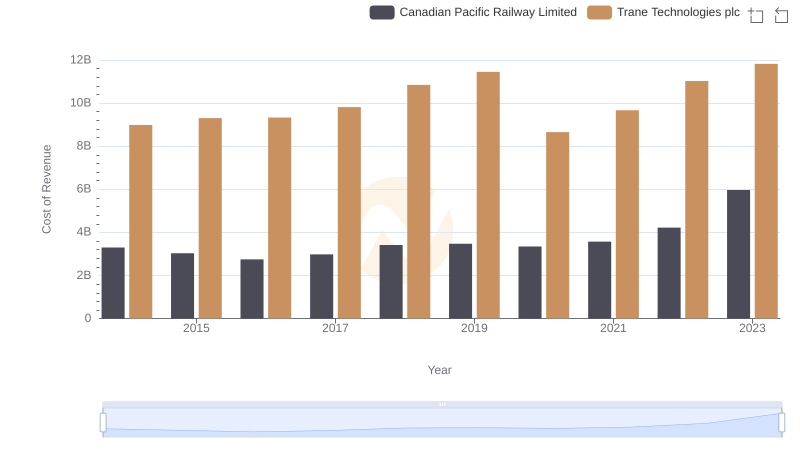
Trane Technologies plc vs Canadian Pacific Railway Limited: Efficiency in Cost of Revenue Explored
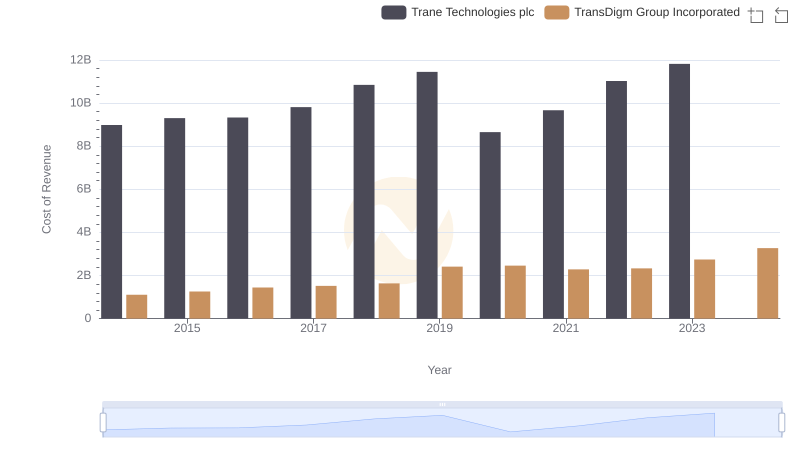
Comparing Cost of Revenue Efficiency: Trane Technologies plc vs TransDigm Group Incorporated
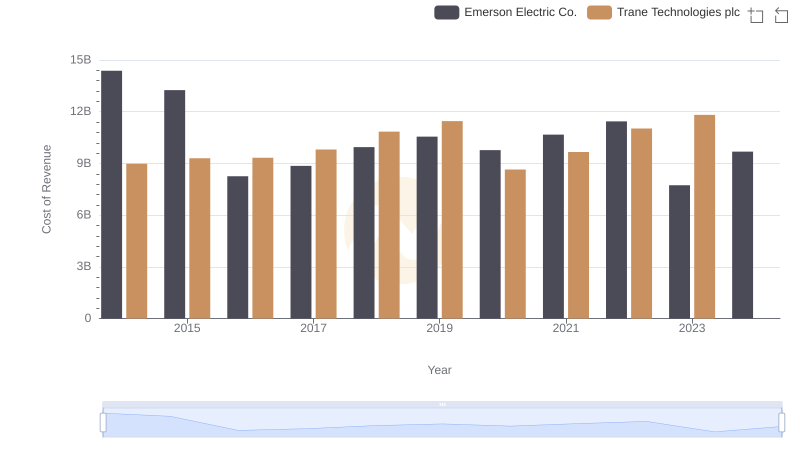
Cost of Revenue Comparison: Trane Technologies plc vs Emerson Electric Co.
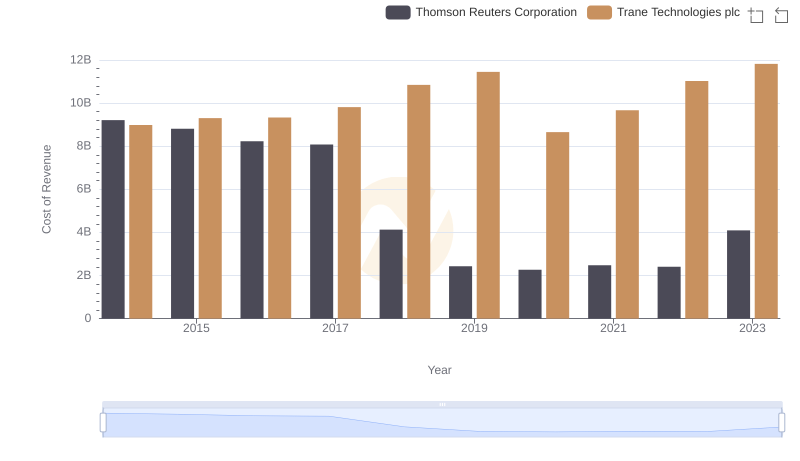
Cost of Revenue Comparison: Trane Technologies plc vs Thomson Reuters Corporation
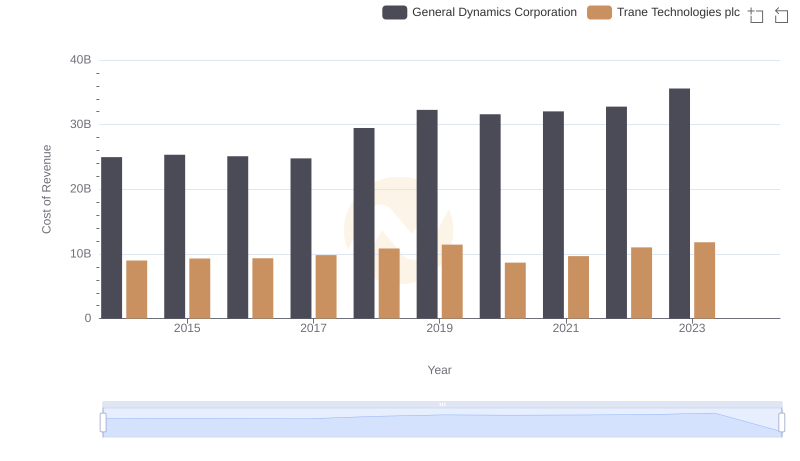
Cost of Revenue Trends: Trane Technologies plc vs General Dynamics Corporation
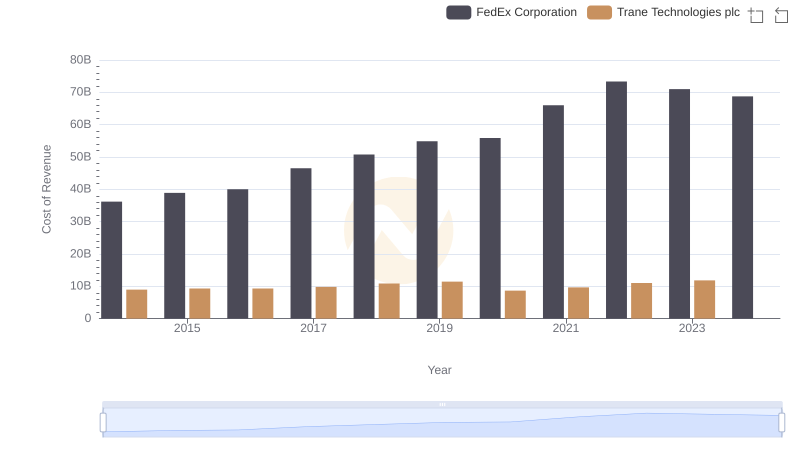
Cost of Revenue Trends: Trane Technologies plc vs FedEx Corporation
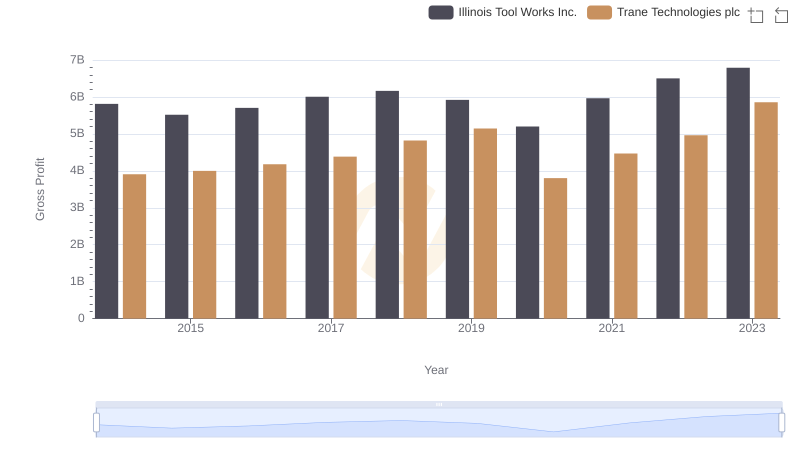
Trane Technologies plc and Illinois Tool Works Inc.: A Detailed Gross Profit Analysis
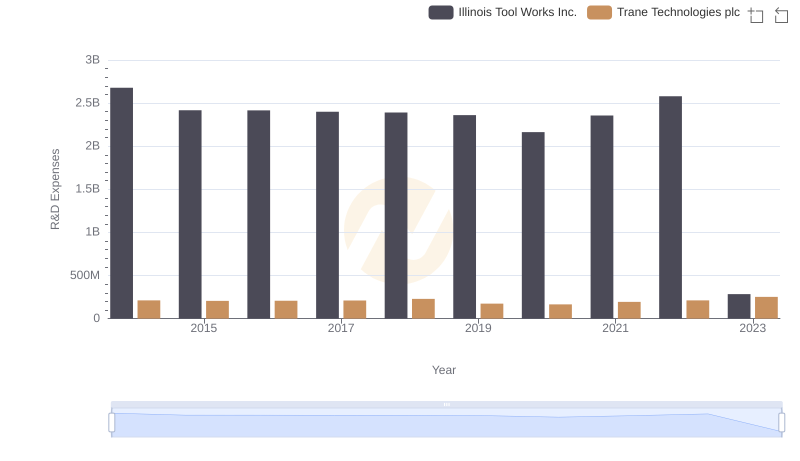
Trane Technologies plc vs Illinois Tool Works Inc.: Strategic Focus on R&D Spending
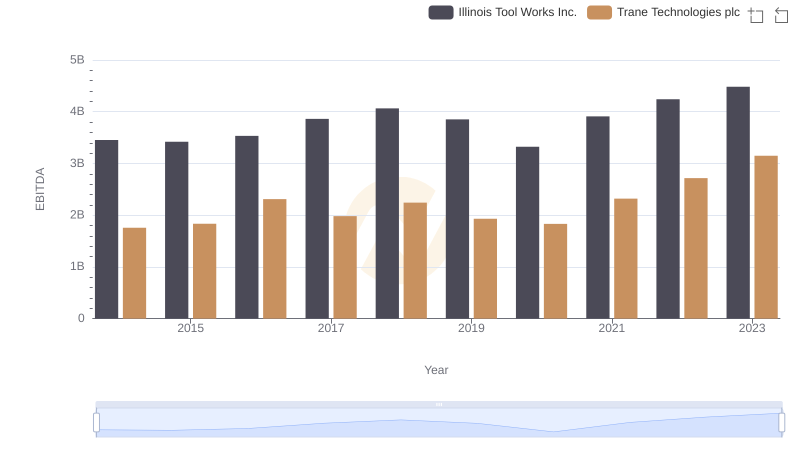
EBITDA Performance Review: Trane Technologies plc vs Illinois Tool Works Inc.