| __timestamp | Republic Services, Inc. | Trane Technologies plc |
|---|---|---|
| Wednesday, January 1, 2014 | 5628100000 | 8982800000 |
| Thursday, January 1, 2015 | 5518600000 | 9301600000 |
| Friday, January 1, 2016 | 5764000000 | 9329300000 |
| Sunday, January 1, 2017 | 6214600000 | 9811600000 |
| Monday, January 1, 2018 | 6150000000 | 10847600000 |
| Tuesday, January 1, 2019 | 6298400000 | 11451500000 |
| Wednesday, January 1, 2020 | 6100500000 | 8651300000 |
| Friday, January 1, 2021 | 6737700000 | 9666800000 |
| Saturday, January 1, 2022 | 8204700000 | 11026900000 |
| Sunday, January 1, 2023 | 8942200000 | 11820400000 |
| Monday, January 1, 2024 | 9350000000 | 12757700000 |
Igniting the spark of knowledge
In the ever-evolving landscape of industrial and waste management sectors, Trane Technologies plc and Republic Services, Inc. stand as titans. From 2014 to 2023, these companies have showcased a dynamic shift in their cost of revenue. Trane Technologies, a leader in climate innovation, saw its cost of revenue grow by approximately 32%, peaking in 2023. Meanwhile, Republic Services, a key player in waste management, experienced a remarkable 59% increase over the same period.
This data not only underscores the financial health of these companies but also reflects broader industry trends, offering valuable insights for investors and industry analysts alike.
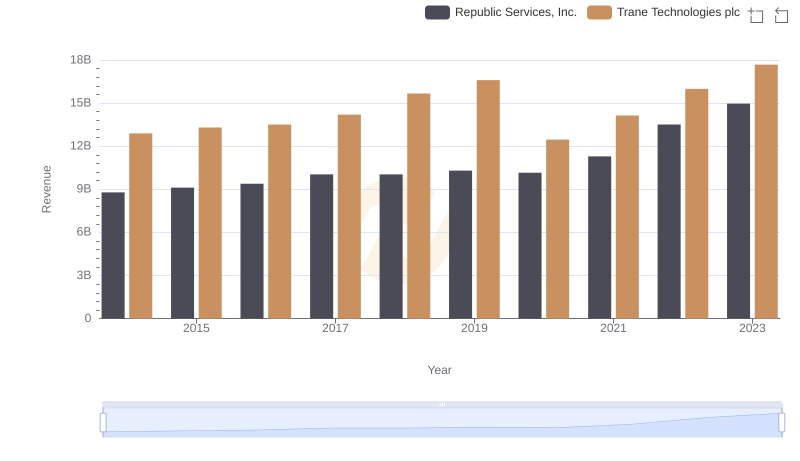
Revenue Insights: Trane Technologies plc and Republic Services, Inc. Performance Compared
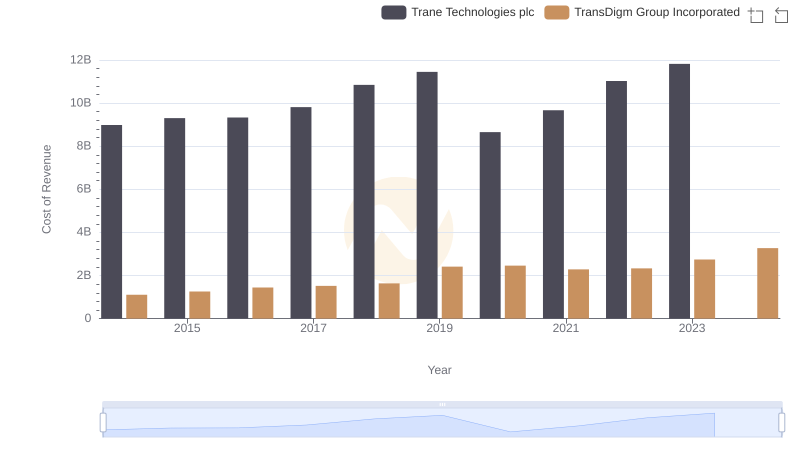
Comparing Cost of Revenue Efficiency: Trane Technologies plc vs TransDigm Group Incorporated
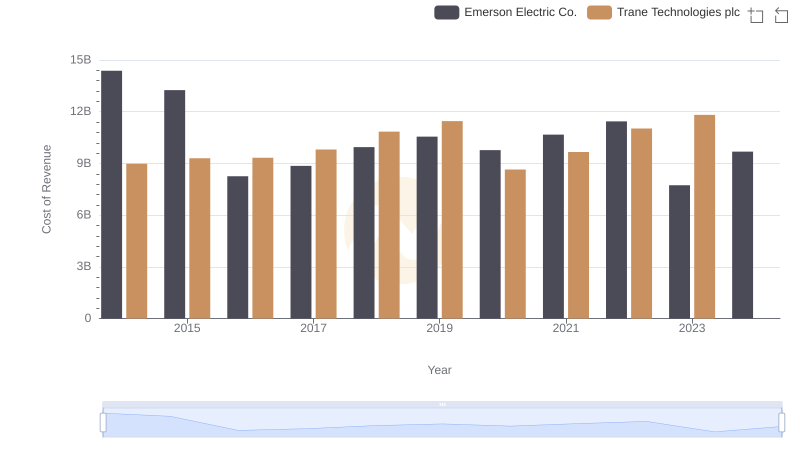
Cost of Revenue Comparison: Trane Technologies plc vs Emerson Electric Co.
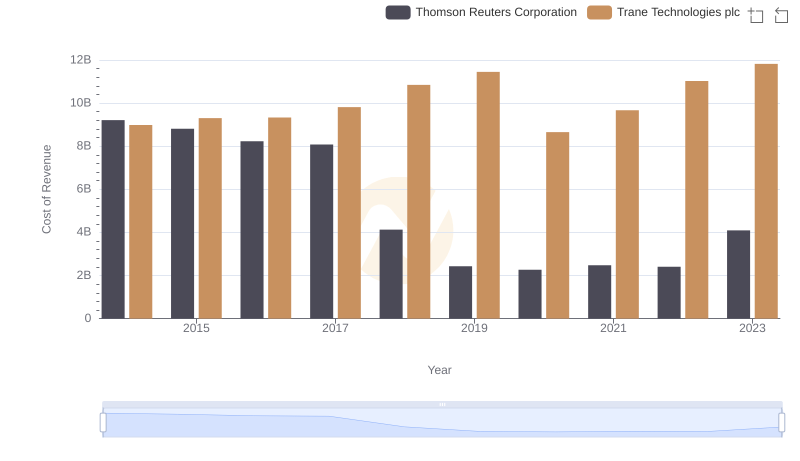
Cost of Revenue Comparison: Trane Technologies plc vs Thomson Reuters Corporation
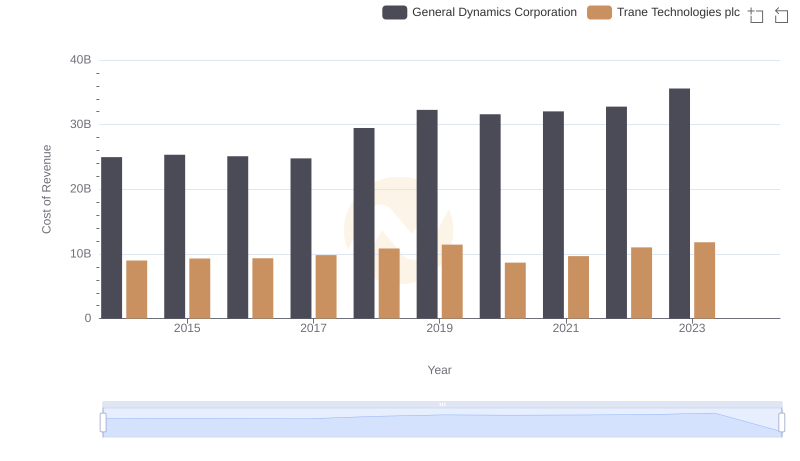
Cost of Revenue Trends: Trane Technologies plc vs General Dynamics Corporation
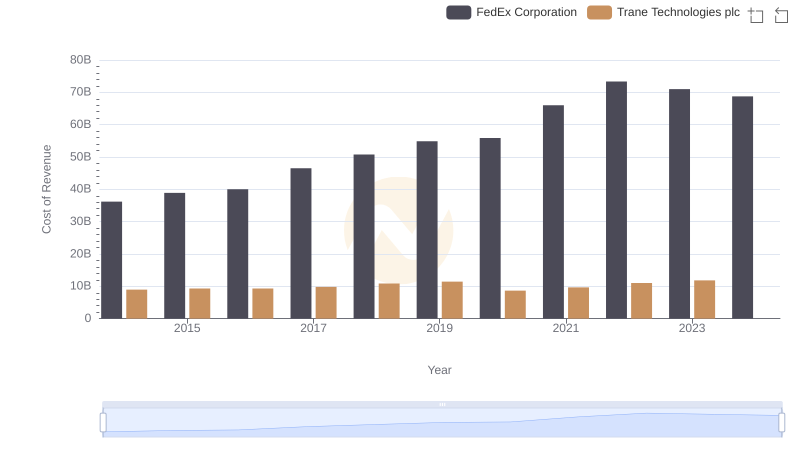
Cost of Revenue Trends: Trane Technologies plc vs FedEx Corporation
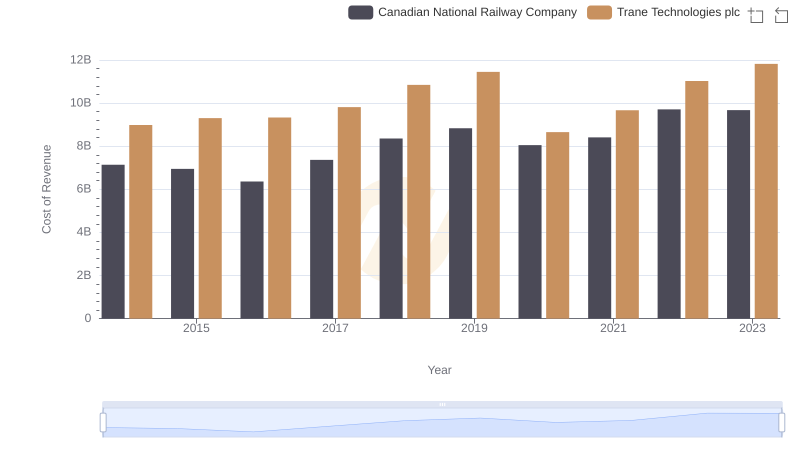
Cost of Revenue Comparison: Trane Technologies plc vs Canadian National Railway Company
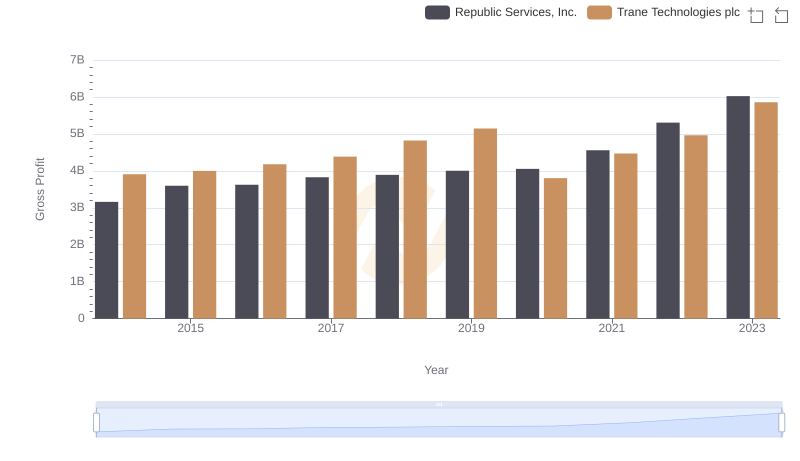
Key Insights on Gross Profit: Trane Technologies plc vs Republic Services, Inc.
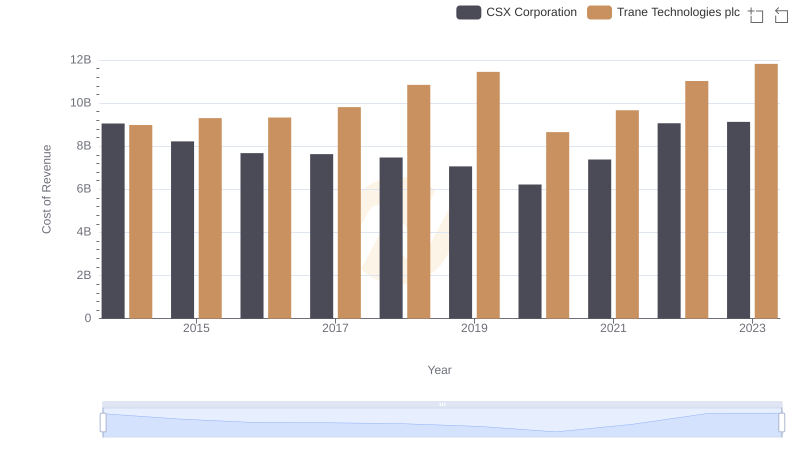
Cost of Revenue Trends: Trane Technologies plc vs CSX Corporation
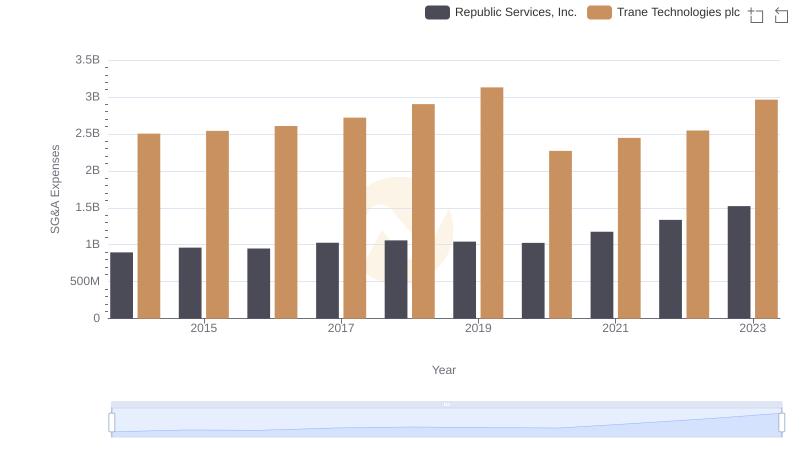
Cost Management Insights: SG&A Expenses for Trane Technologies plc and Republic Services, Inc.