| __timestamp | Emerson Electric Co. | Trane Technologies plc |
|---|---|---|
| Wednesday, January 1, 2014 | 4397000000 | 1757000000 |
| Thursday, January 1, 2015 | 4578000000 | 1835000000 |
| Friday, January 1, 2016 | 3099000000 | 2311000000 |
| Sunday, January 1, 2017 | 3172000000 | 1982500000 |
| Monday, January 1, 2018 | 3627000000 | 2242400000 |
| Tuesday, January 1, 2019 | 3882000000 | 1931200000 |
| Wednesday, January 1, 2020 | 3364000000 | 1831900000 |
| Friday, January 1, 2021 | 4047000000 | 2319200000 |
| Saturday, January 1, 2022 | 3502000000 | 2715500000 |
| Sunday, January 1, 2023 | 4038000000 | 3149900000 |
| Monday, January 1, 2024 | 4032000000 | 3859600000 |
Unleashing the power of data
In the ever-evolving landscape of industrial innovation, Trane Technologies plc and Emerson Electric Co. have been pivotal players. Over the past decade, Emerson Electric has consistently outperformed Trane Technologies in terms of EBITDA, with an average of approximately 3.8 billion annually, compared to Trane's 2.2 billion. However, the gap has been narrowing. In 2023, Trane Technologies achieved a remarkable 43% increase in EBITDA from 2022, reaching 3.15 billion, while Emerson Electric saw a modest 15% rise. This trend highlights Trane's aggressive growth strategy and market adaptation. Notably, 2024 data for Trane is missing, leaving room for speculation on whether this upward trajectory will continue. As these industrial giants continue to innovate, stakeholders and investors should keep a keen eye on their financial health and strategic maneuvers.
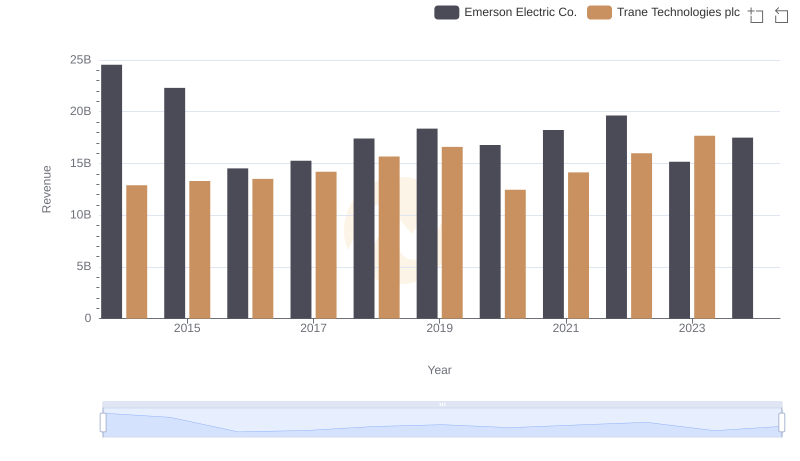
Revenue Insights: Trane Technologies plc and Emerson Electric Co. Performance Compared
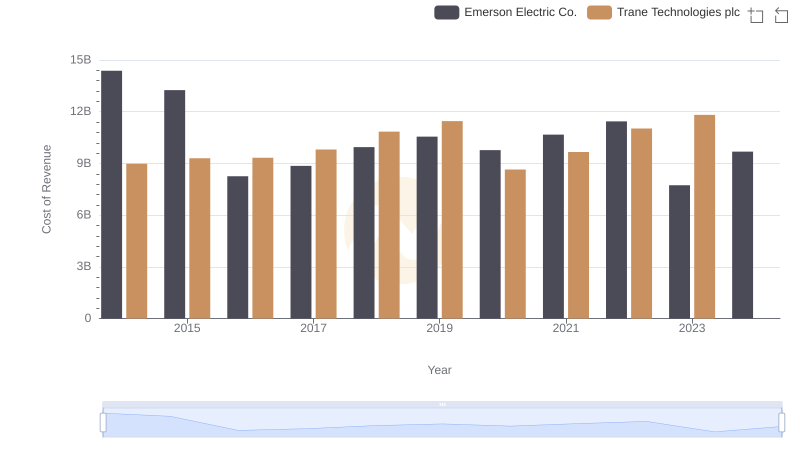
Cost of Revenue Comparison: Trane Technologies plc vs Emerson Electric Co.
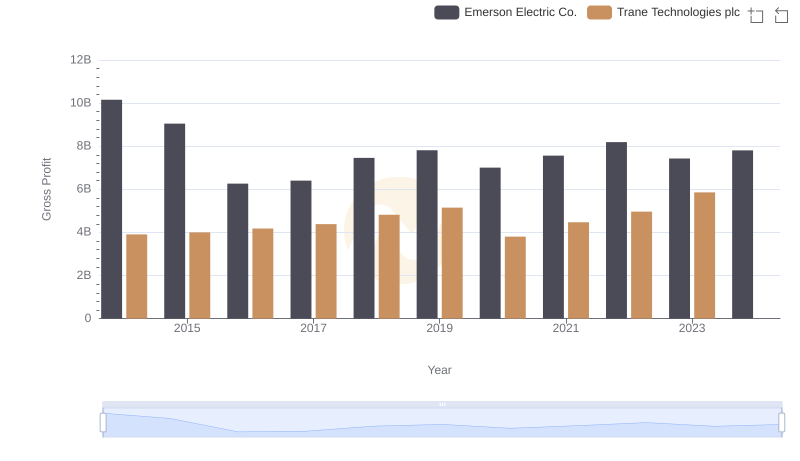
Gross Profit Trends Compared: Trane Technologies plc vs Emerson Electric Co.
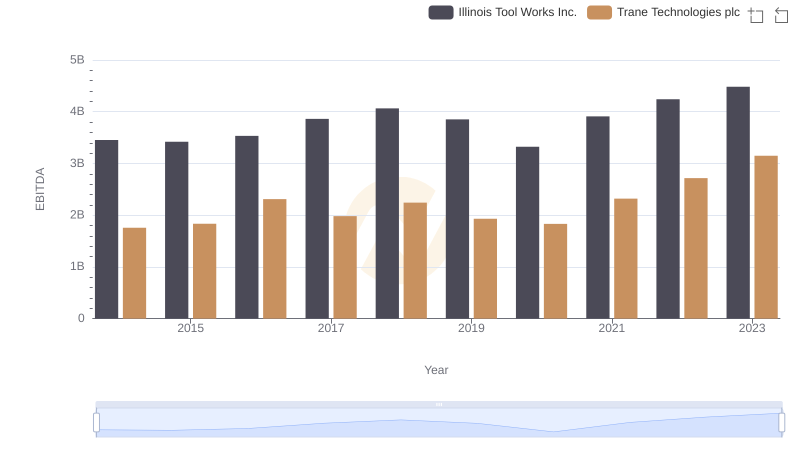
EBITDA Performance Review: Trane Technologies plc vs Illinois Tool Works Inc.
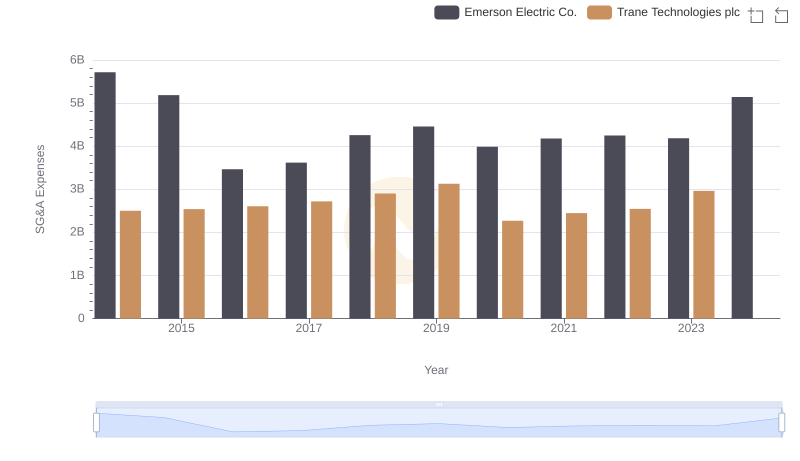
Operational Costs Compared: SG&A Analysis of Trane Technologies plc and Emerson Electric Co.
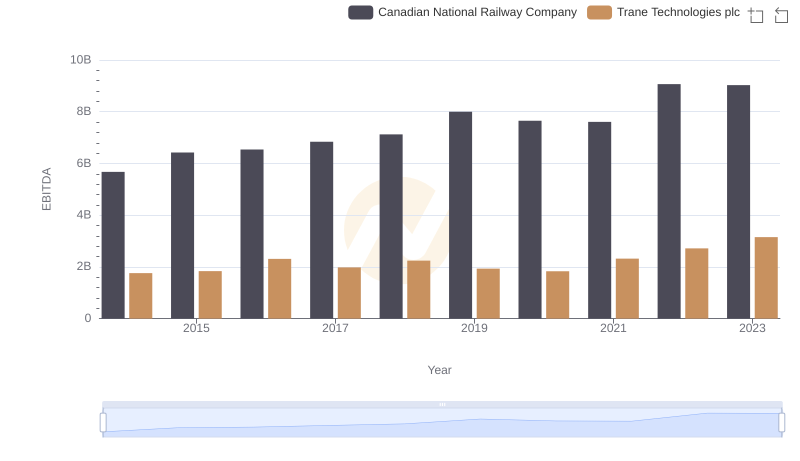
A Professional Review of EBITDA: Trane Technologies plc Compared to Canadian National Railway Company
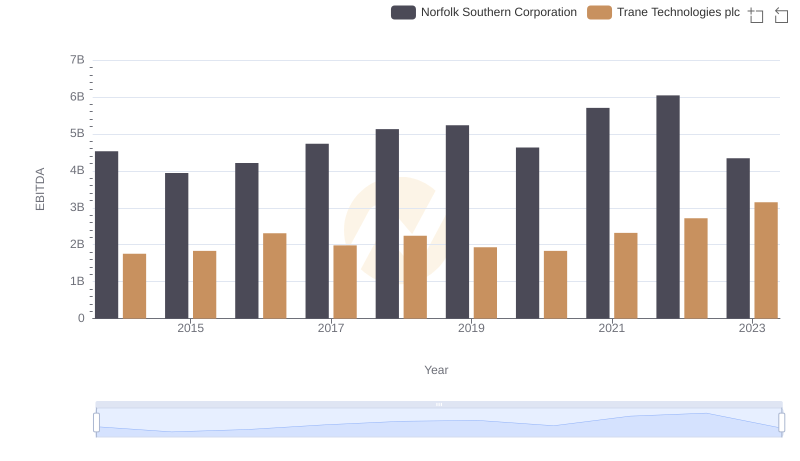
EBITDA Analysis: Evaluating Trane Technologies plc Against Norfolk Southern Corporation
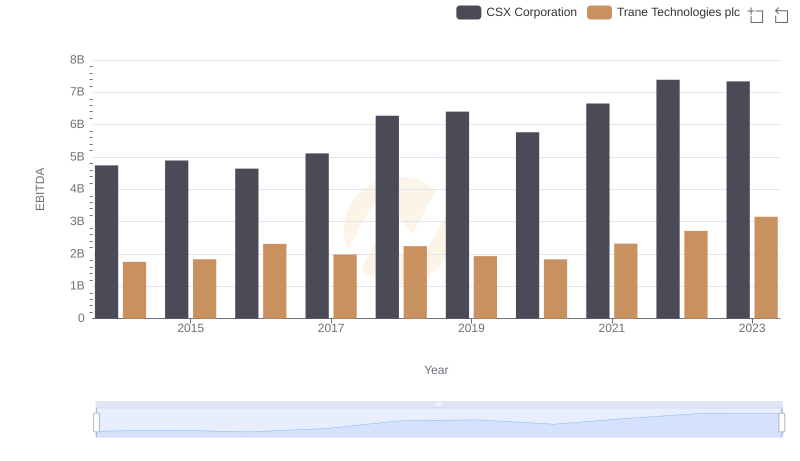
EBITDA Performance Review: Trane Technologies plc vs CSX Corporation
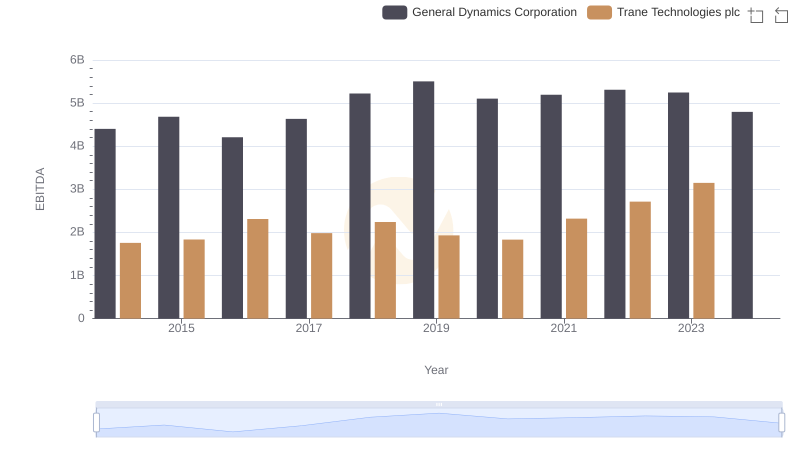
Professional EBITDA Benchmarking: Trane Technologies plc vs General Dynamics Corporation
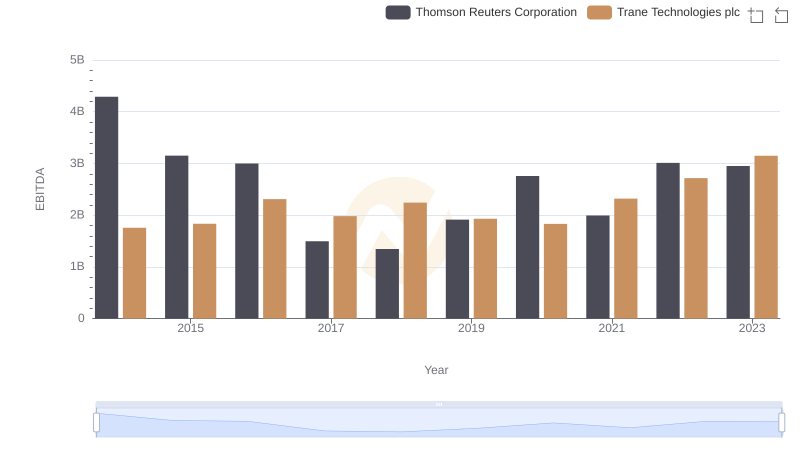
A Side-by-Side Analysis of EBITDA: Trane Technologies plc and Thomson Reuters Corporation