| __timestamp | Emerson Electric Co. | Trane Technologies plc |
|---|---|---|
| Wednesday, January 1, 2014 | 24537000000 | 12891400000 |
| Thursday, January 1, 2015 | 22304000000 | 13300700000 |
| Friday, January 1, 2016 | 14522000000 | 13508900000 |
| Sunday, January 1, 2017 | 15264000000 | 14197600000 |
| Monday, January 1, 2018 | 17408000000 | 15668200000 |
| Tuesday, January 1, 2019 | 18372000000 | 16598900000 |
| Wednesday, January 1, 2020 | 16785000000 | 12454700000 |
| Friday, January 1, 2021 | 18236000000 | 14136400000 |
| Saturday, January 1, 2022 | 19629000000 | 15991700000 |
| Sunday, January 1, 2023 | 15165000000 | 17677600000 |
| Monday, January 1, 2024 | 17492000000 | 19838200000 |
Cracking the code
In the ever-evolving landscape of industrial innovation, Trane Technologies plc and Emerson Electric Co. have been pivotal players. Over the past decade, these giants have showcased intriguing revenue trajectories. From 2014 to 2023, Emerson Electric's revenue peaked in 2014, with a notable 24% decline by 2023. Meanwhile, Trane Technologies demonstrated resilience, with a 37% increase in revenue from 2014 to 2023, despite a dip in 2020. This period marked a significant shift, as Trane Technologies surpassed Emerson Electric in 2023, highlighting its strategic growth. The data reveals a compelling narrative of adaptation and market dynamics, with Trane Technologies emerging as a formidable competitor. Missing data for 2024 suggests an incomplete picture, yet the trends underscore the importance of strategic agility in the industrial sector.
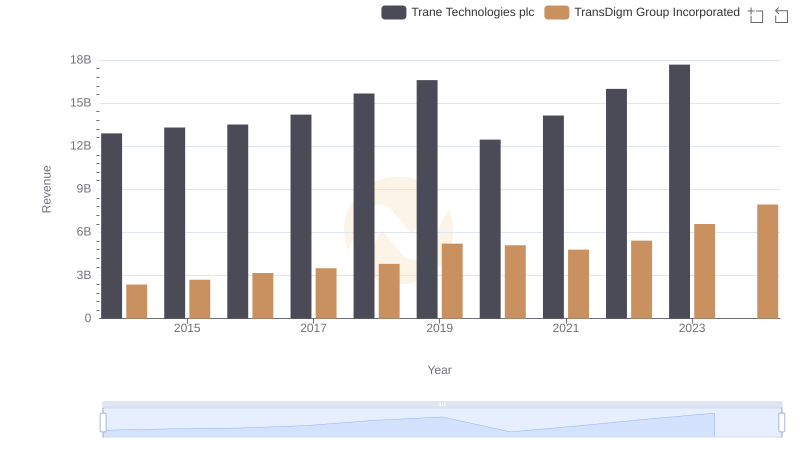
Trane Technologies plc vs TransDigm Group Incorporated: Annual Revenue Growth Compared
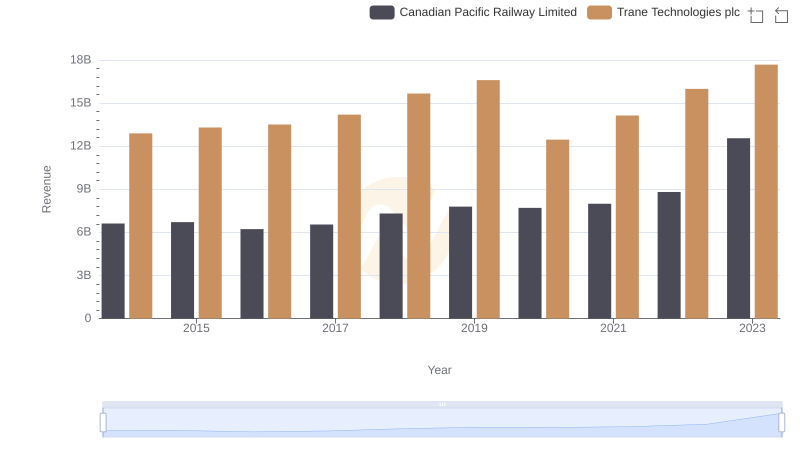
Revenue Showdown: Trane Technologies plc vs Canadian Pacific Railway Limited
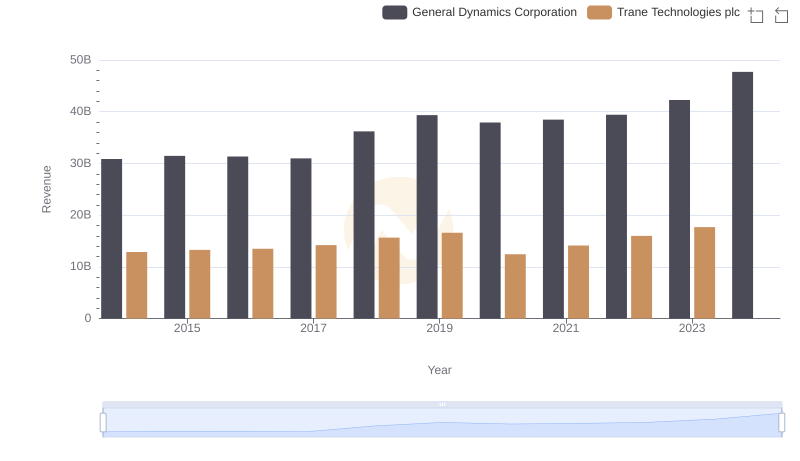
Trane Technologies plc vs General Dynamics Corporation: Annual Revenue Growth Compared
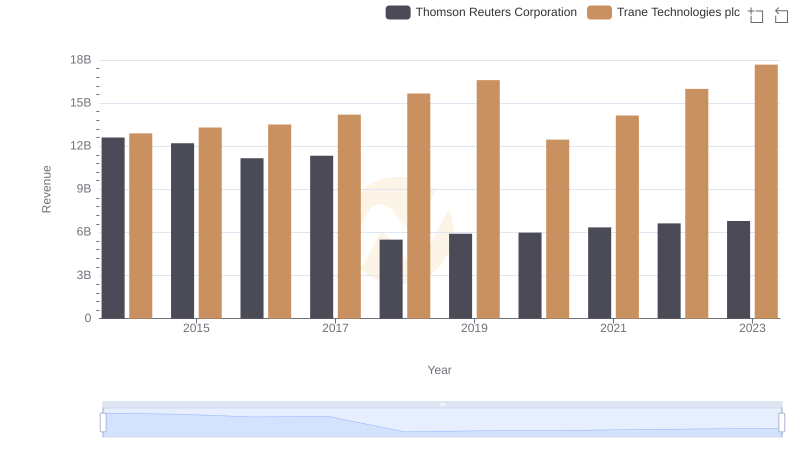
Annual Revenue Comparison: Trane Technologies plc vs Thomson Reuters Corporation
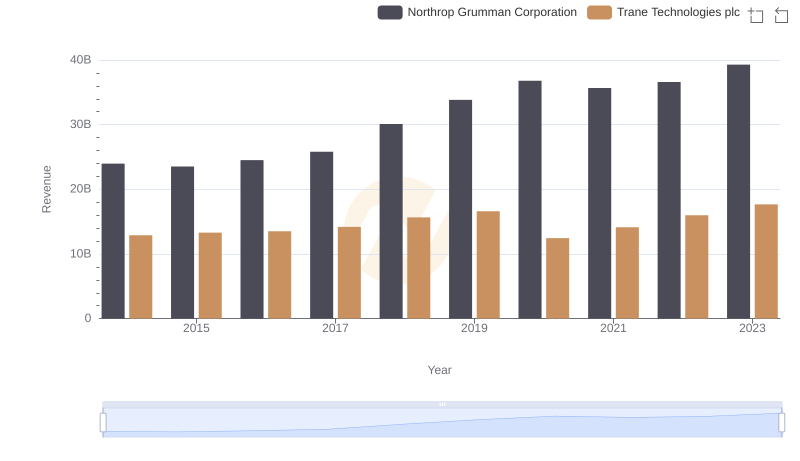
Breaking Down Revenue Trends: Trane Technologies plc vs Northrop Grumman Corporation
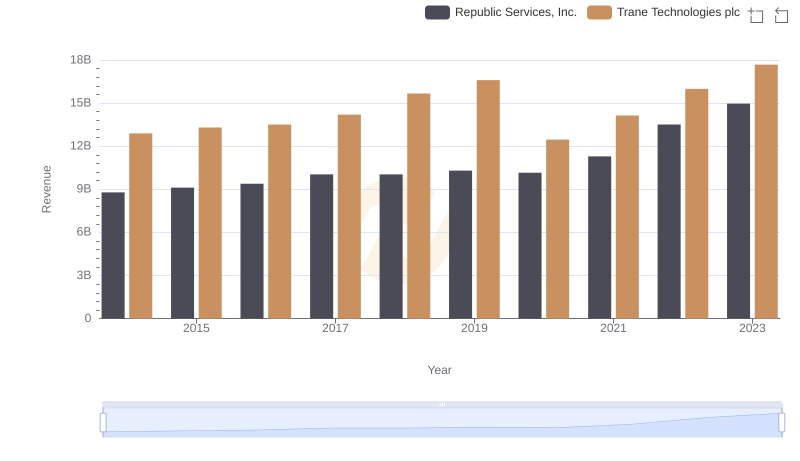
Revenue Insights: Trane Technologies plc and Republic Services, Inc. Performance Compared
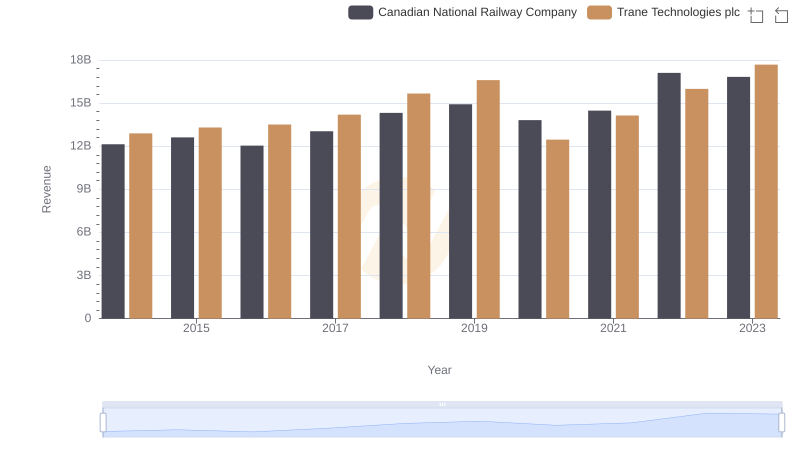
Trane Technologies plc and Canadian National Railway Company: A Comprehensive Revenue Analysis
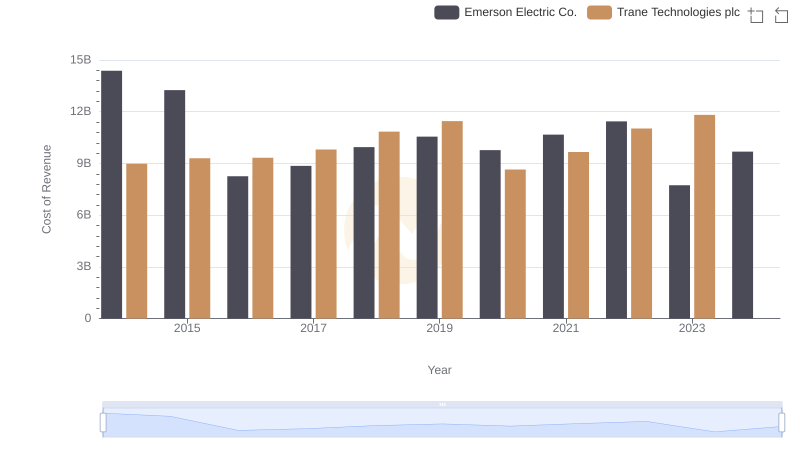
Cost of Revenue Comparison: Trane Technologies plc vs Emerson Electric Co.
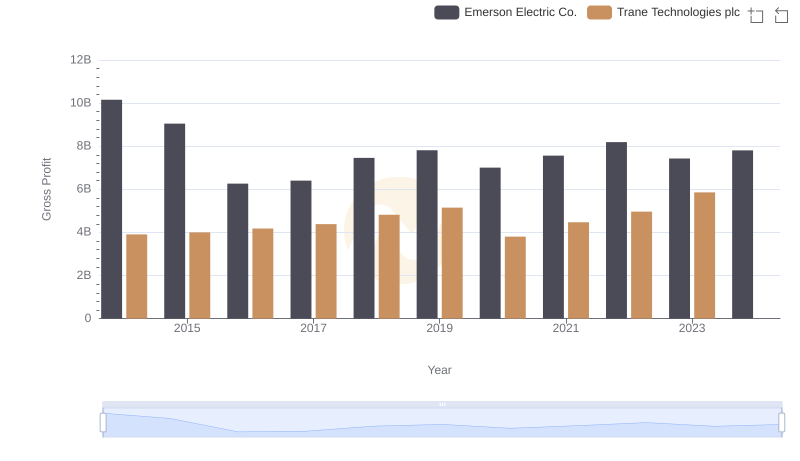
Gross Profit Trends Compared: Trane Technologies plc vs Emerson Electric Co.
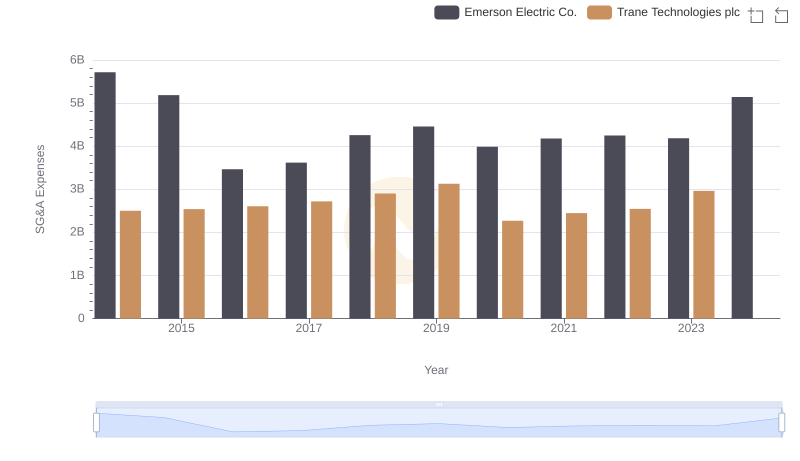
Operational Costs Compared: SG&A Analysis of Trane Technologies plc and Emerson Electric Co.
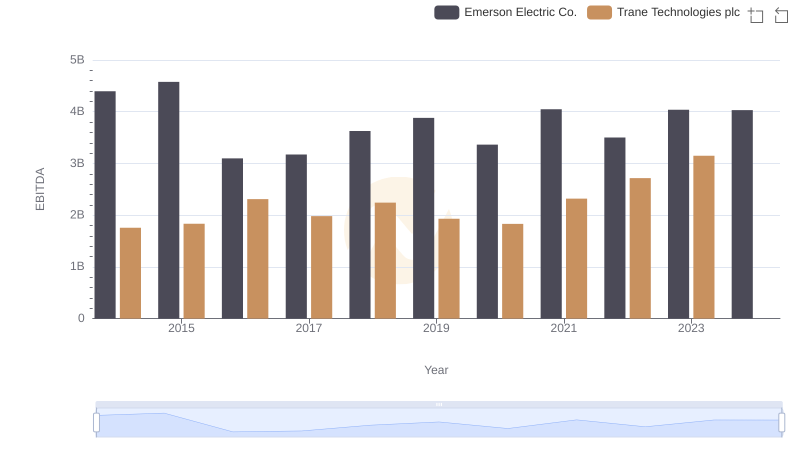
Comparative EBITDA Analysis: Trane Technologies plc vs Emerson Electric Co.