| __timestamp | Trane Technologies plc | TransDigm Group Incorporated |
|---|---|---|
| Wednesday, January 1, 2014 | 8982800000 | 1105032000 |
| Thursday, January 1, 2015 | 9301600000 | 1257270000 |
| Friday, January 1, 2016 | 9329300000 | 1443348000 |
| Sunday, January 1, 2017 | 9811600000 | 1519659000 |
| Monday, January 1, 2018 | 10847600000 | 1633616000 |
| Tuesday, January 1, 2019 | 11451500000 | 2413932000 |
| Wednesday, January 1, 2020 | 8651300000 | 2456000000 |
| Friday, January 1, 2021 | 9666800000 | 2285000000 |
| Saturday, January 1, 2022 | 11026900000 | 2330000000 |
| Sunday, January 1, 2023 | 11820400000 | 2743000000 |
| Monday, January 1, 2024 | 12757700000 | 3268000000 |
Cracking the code
In the competitive landscape of industrial giants, Trane Technologies plc and TransDigm Group Incorporated have showcased distinct trajectories in cost of revenue efficiency over the past decade. From 2014 to 2023, Trane Technologies consistently maintained a higher cost of revenue, peaking at approximately $11.8 billion in 2023. This represents a steady growth of around 31% from its 2014 figures. In contrast, TransDigm Group, while starting at a modest $1.1 billion in 2014, saw a remarkable increase of nearly 196%, reaching $3.3 billion by 2024.
This divergence highlights Trane's stable yet gradual growth, while TransDigm's aggressive expansion strategy is evident. The data for 2024, however, shows a missing entry for Trane, suggesting potential shifts or reporting delays. As these companies continue to evolve, their strategies in managing costs will be pivotal in shaping their future market positions.
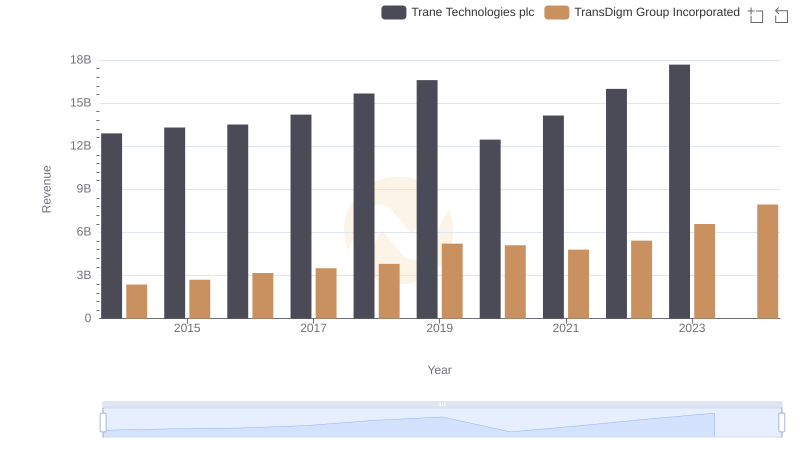
Trane Technologies plc vs TransDigm Group Incorporated: Annual Revenue Growth Compared
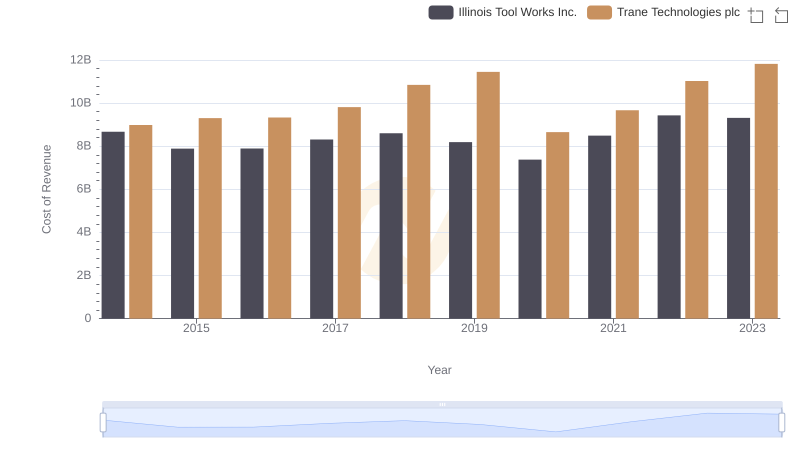
Trane Technologies plc vs Illinois Tool Works Inc.: Efficiency in Cost of Revenue Explored
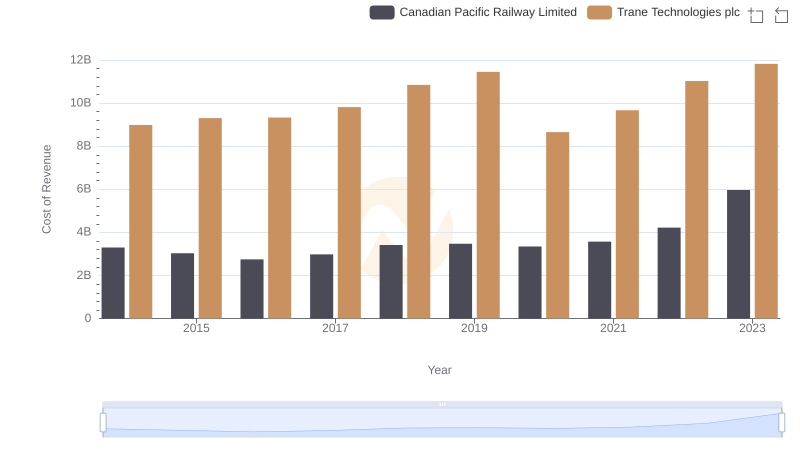
Trane Technologies plc vs Canadian Pacific Railway Limited: Efficiency in Cost of Revenue Explored
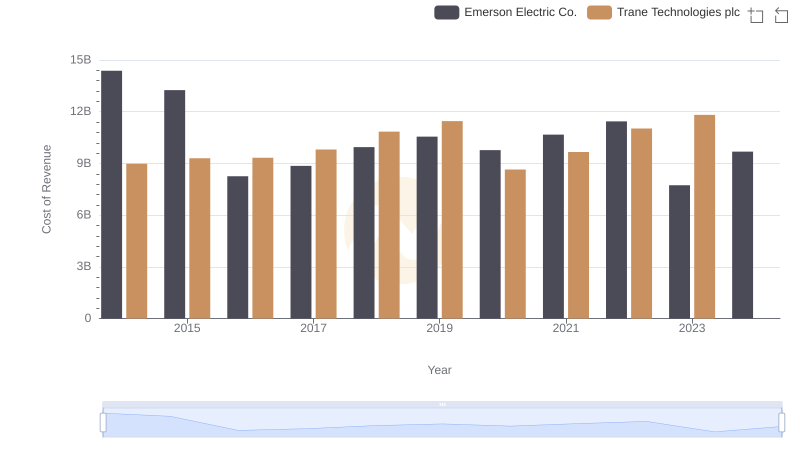
Cost of Revenue Comparison: Trane Technologies plc vs Emerson Electric Co.
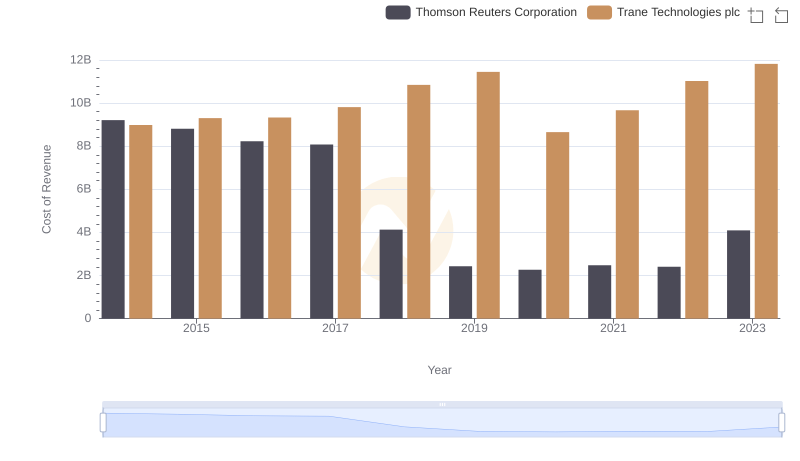
Cost of Revenue Comparison: Trane Technologies plc vs Thomson Reuters Corporation
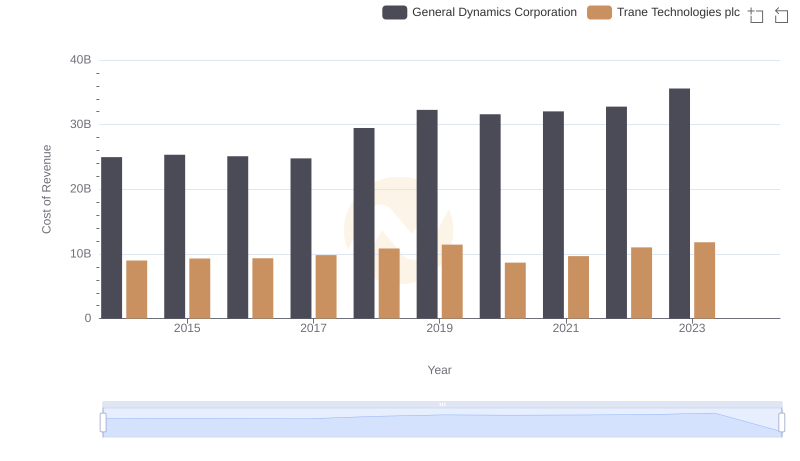
Cost of Revenue Trends: Trane Technologies plc vs General Dynamics Corporation
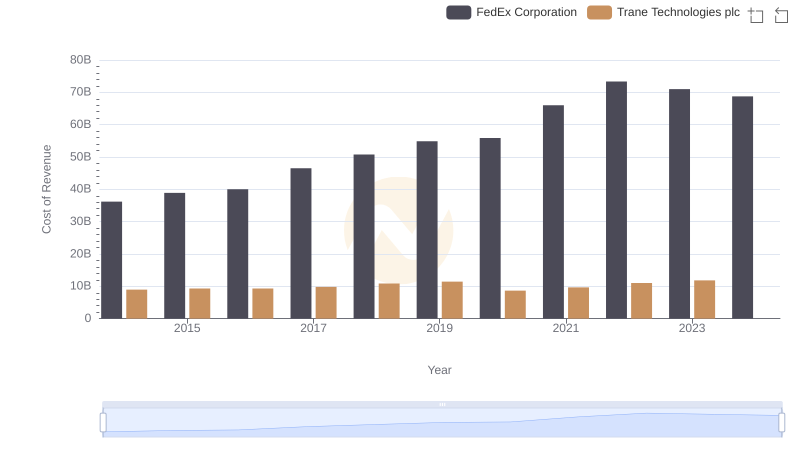
Cost of Revenue Trends: Trane Technologies plc vs FedEx Corporation
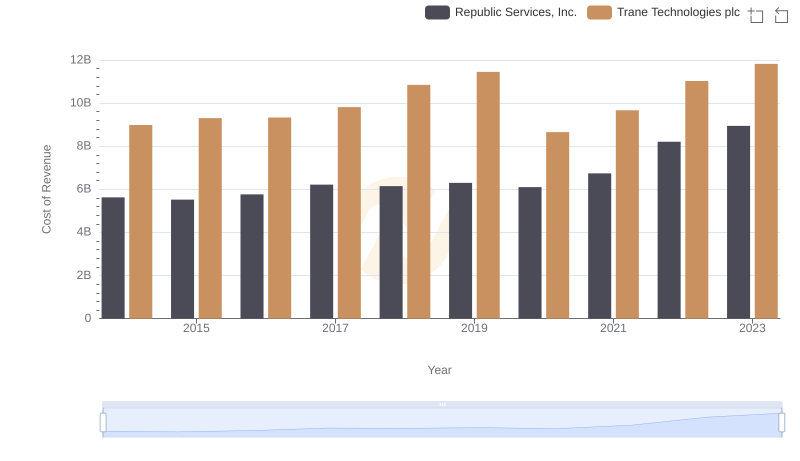
Analyzing Cost of Revenue: Trane Technologies plc and Republic Services, Inc.
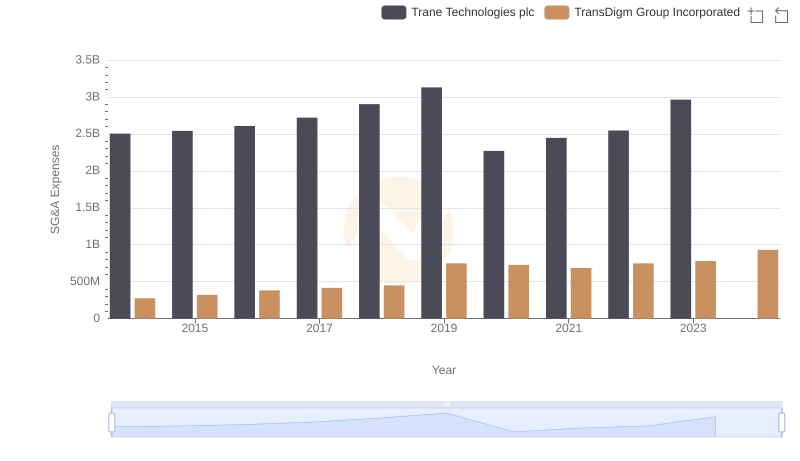
Trane Technologies plc and TransDigm Group Incorporated: SG&A Spending Patterns Compared