| __timestamp | Emerson Electric Co. | Trane Technologies plc |
|---|---|---|
| Wednesday, January 1, 2014 | 5715000000 | 2503900000 |
| Thursday, January 1, 2015 | 5184000000 | 2541100000 |
| Friday, January 1, 2016 | 3464000000 | 2606500000 |
| Sunday, January 1, 2017 | 3618000000 | 2720700000 |
| Monday, January 1, 2018 | 4258000000 | 2903200000 |
| Tuesday, January 1, 2019 | 4457000000 | 3129800000 |
| Wednesday, January 1, 2020 | 3986000000 | 2270600000 |
| Friday, January 1, 2021 | 4179000000 | 2446300000 |
| Saturday, January 1, 2022 | 4248000000 | 2545900000 |
| Sunday, January 1, 2023 | 4186000000 | 2963200000 |
| Monday, January 1, 2024 | 5142000000 | 3580400000 |
Unleashing insights
In the ever-evolving landscape of industrial giants, operational efficiency is key. Over the past decade, Trane Technologies plc and Emerson Electric Co. have showcased distinct trajectories in their Selling, General, and Administrative (SG&A) expenses. From 2014 to 2023, Emerson Electric's SG&A expenses fluctuated, peaking in 2014 and 2024, with a notable dip in 2016. Meanwhile, Trane Technologies displayed a more consistent pattern, with a significant drop in 2020, likely influenced by global economic shifts. By 2023, Trane's SG&A expenses rebounded, nearing 3 billion, while Emerson's hovered around 4.2 billion. This analysis highlights the strategic financial maneuvers of these companies, reflecting broader market trends and internal efficiencies. Missing data for Trane in 2024 suggests a potential shift or restructuring. As these industry leaders navigate future challenges, their SG&A strategies will remain pivotal in maintaining competitive edges.
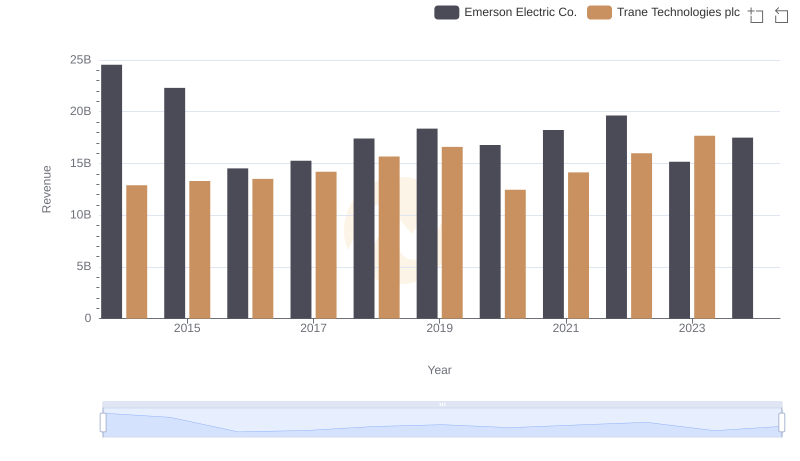
Revenue Insights: Trane Technologies plc and Emerson Electric Co. Performance Compared
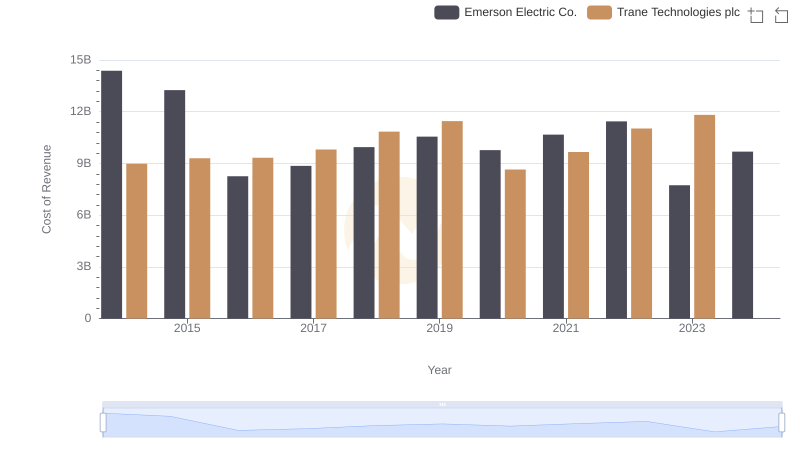
Cost of Revenue Comparison: Trane Technologies plc vs Emerson Electric Co.
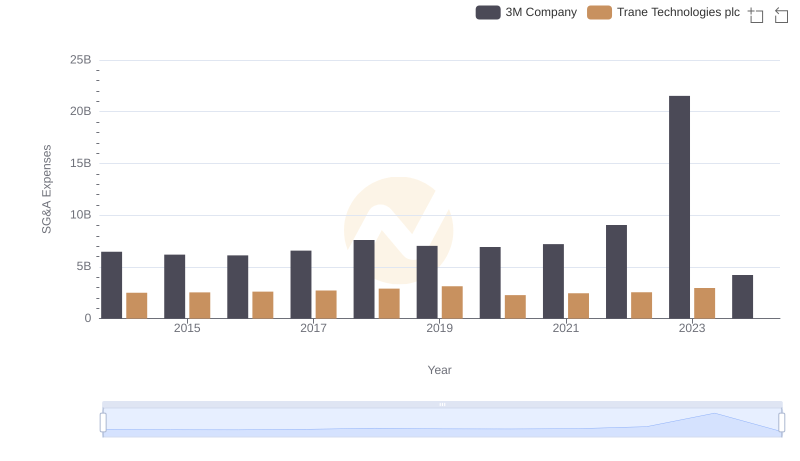
Breaking Down SG&A Expenses: Trane Technologies plc vs 3M Company
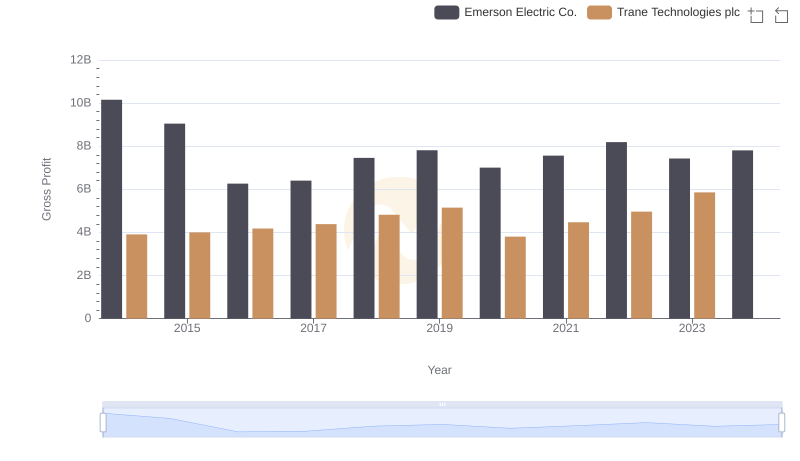
Gross Profit Trends Compared: Trane Technologies plc vs Emerson Electric Co.
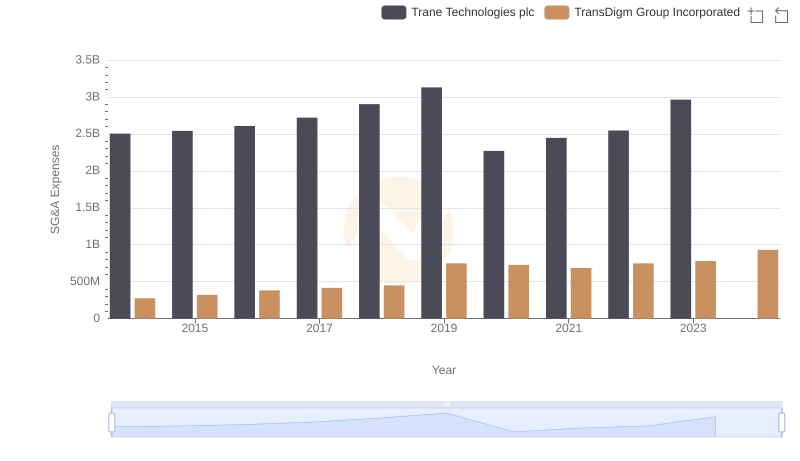
Trane Technologies plc and TransDigm Group Incorporated: SG&A Spending Patterns Compared
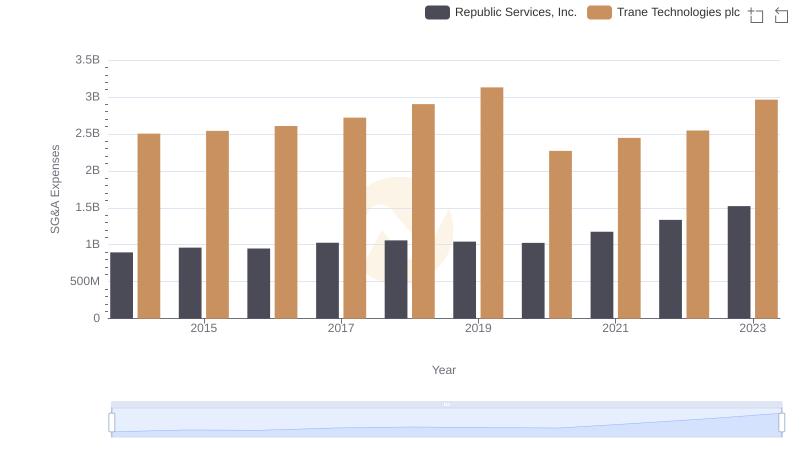
Cost Management Insights: SG&A Expenses for Trane Technologies plc and Republic Services, Inc.
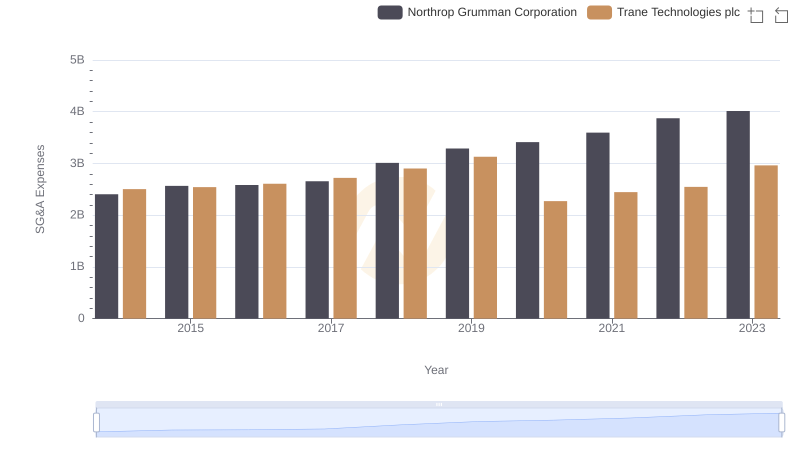
Trane Technologies plc vs Northrop Grumman Corporation: SG&A Expense Trends
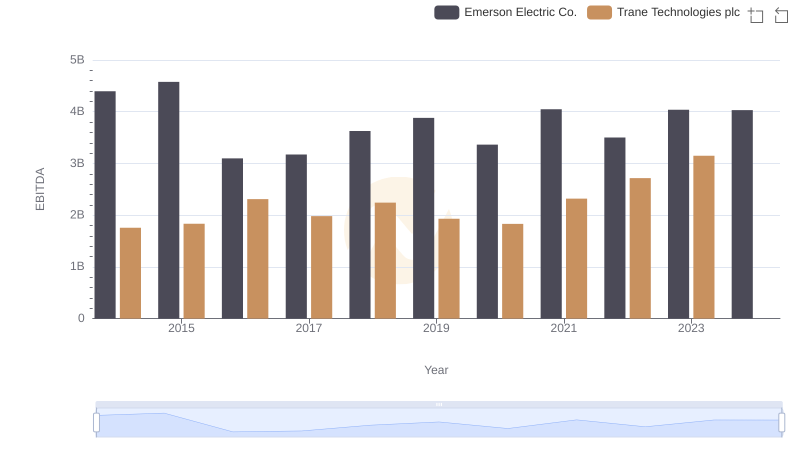
Comparative EBITDA Analysis: Trane Technologies plc vs Emerson Electric Co.
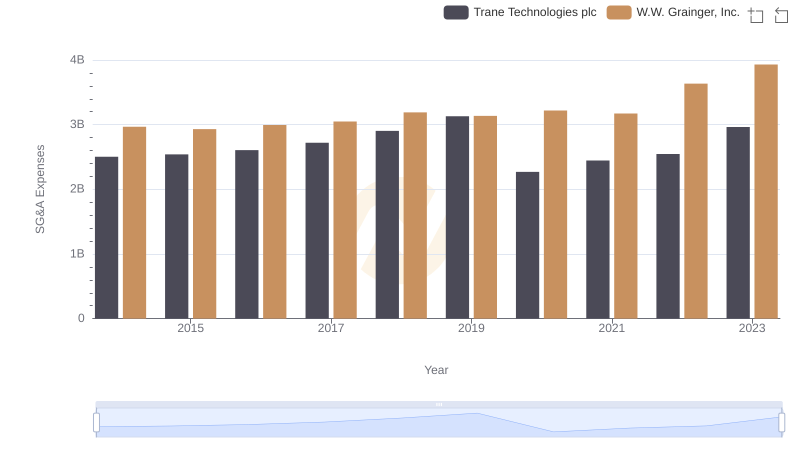
Who Optimizes SG&A Costs Better? Trane Technologies plc or W.W. Grainger, Inc.