| __timestamp | FedEx Corporation | Trane Technologies plc |
|---|---|---|
| Wednesday, January 1, 2014 | 36194000000 | 8982800000 |
| Thursday, January 1, 2015 | 38895000000 | 9301600000 |
| Friday, January 1, 2016 | 40037000000 | 9329300000 |
| Sunday, January 1, 2017 | 46511000000 | 9811600000 |
| Monday, January 1, 2018 | 50750000000 | 10847600000 |
| Tuesday, January 1, 2019 | 54866000000 | 11451500000 |
| Wednesday, January 1, 2020 | 55873000000 | 8651300000 |
| Friday, January 1, 2021 | 66005000000 | 9666800000 |
| Saturday, January 1, 2022 | 73345000000 | 11026900000 |
| Sunday, January 1, 2023 | 70989000000 | 11820400000 |
| Monday, January 1, 2024 | 68741000000 | 12757700000 |
Data in motion
In the ever-evolving landscape of global business, understanding cost structures is pivotal. This analysis delves into the cost of revenue trends for Trane Technologies plc and FedEx Corporation from 2014 to 2023. Over this decade, FedEx Corporation has consistently demonstrated a robust cost of revenue, peaking in 2022 with a 103% increase from 2014. This reflects its expansive logistics operations and global reach. In contrast, Trane Technologies plc, a leader in climate solutions, has shown a steady growth trajectory, with a notable 32% rise in cost of revenue from 2014 to 2023. The data reveals a missing value for Trane Technologies in 2024, indicating potential shifts or reporting changes. This comparative insight underscores the dynamic nature of operational costs in different industries, offering a window into strategic financial management.
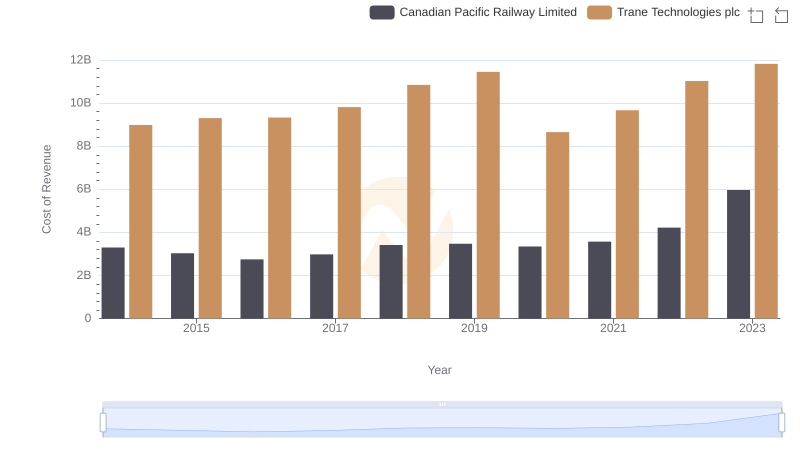
Trane Technologies plc vs Canadian Pacific Railway Limited: Efficiency in Cost of Revenue Explored
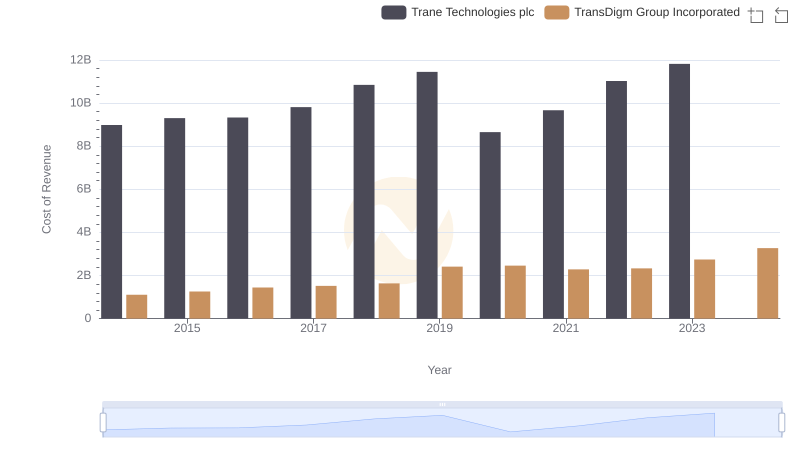
Comparing Cost of Revenue Efficiency: Trane Technologies plc vs TransDigm Group Incorporated
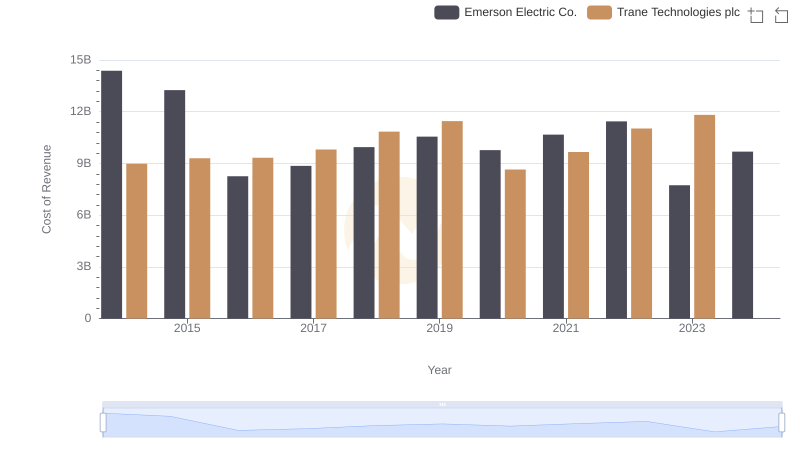
Cost of Revenue Comparison: Trane Technologies plc vs Emerson Electric Co.
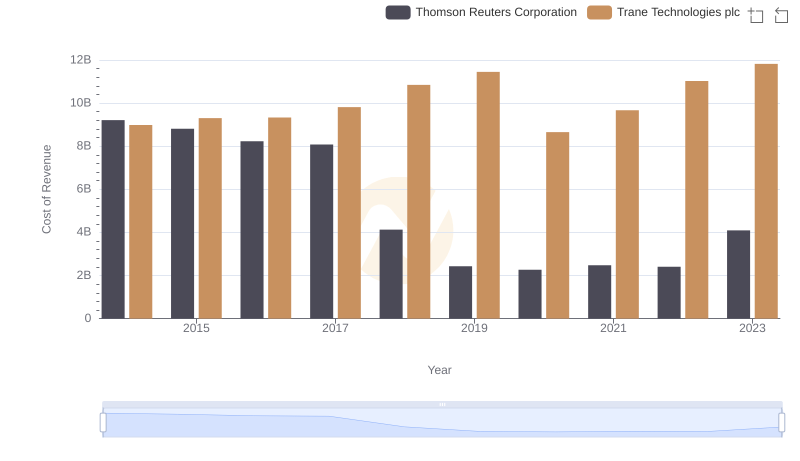
Cost of Revenue Comparison: Trane Technologies plc vs Thomson Reuters Corporation
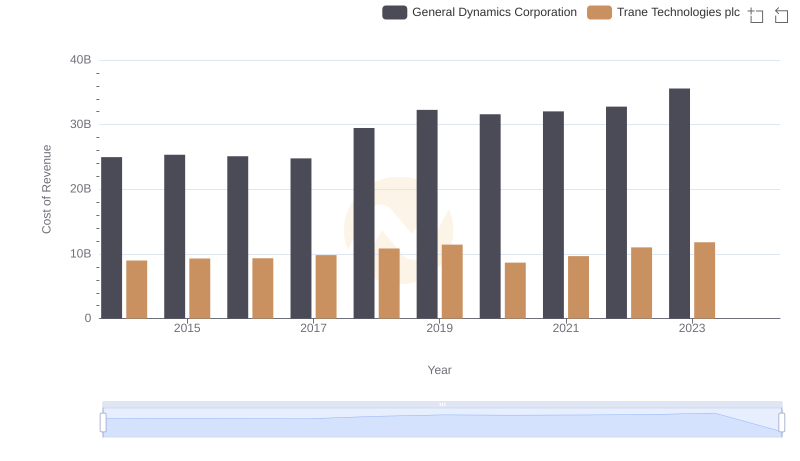
Cost of Revenue Trends: Trane Technologies plc vs General Dynamics Corporation
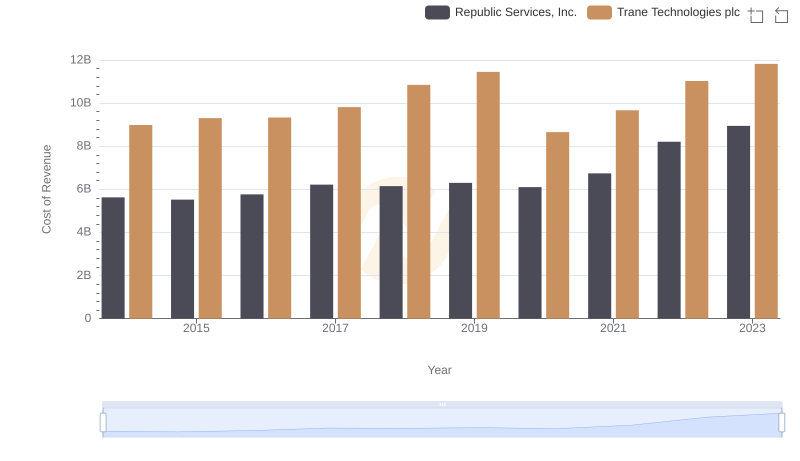
Analyzing Cost of Revenue: Trane Technologies plc and Republic Services, Inc.
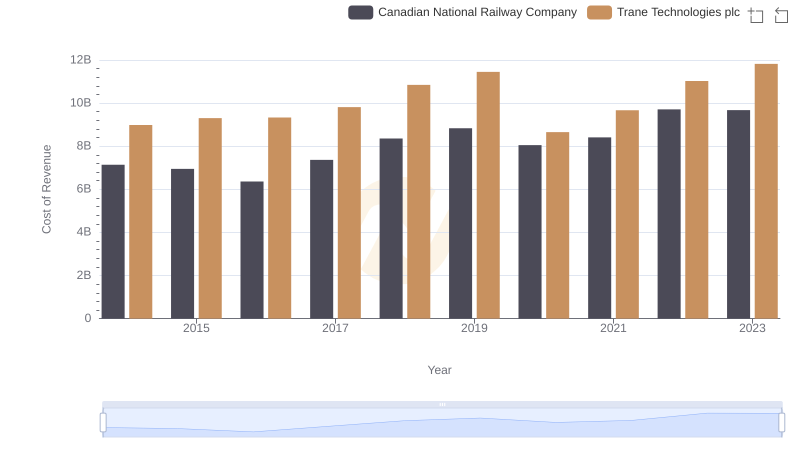
Cost of Revenue Comparison: Trane Technologies plc vs Canadian National Railway Company
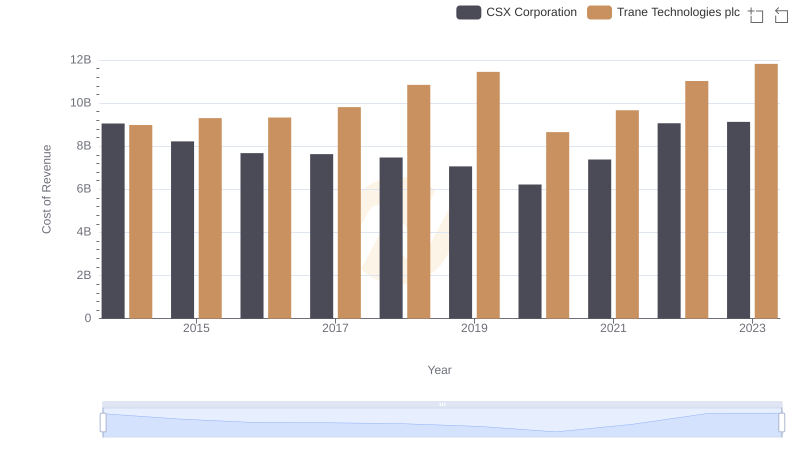
Cost of Revenue Trends: Trane Technologies plc vs CSX Corporation
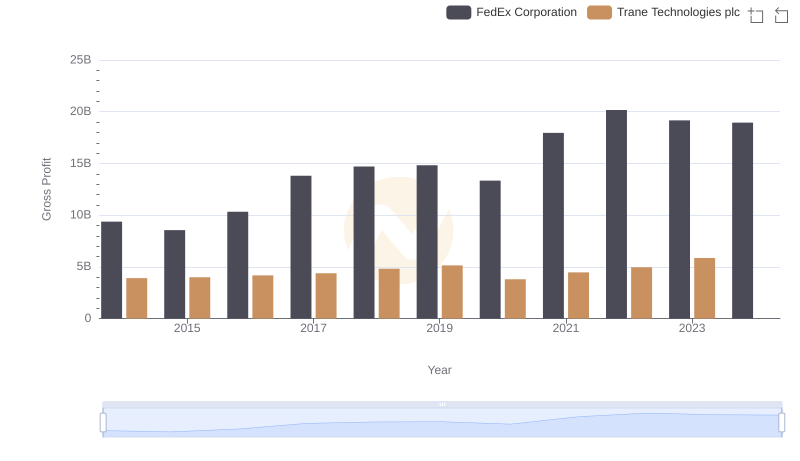
Gross Profit Trends Compared: Trane Technologies plc vs FedEx Corporation
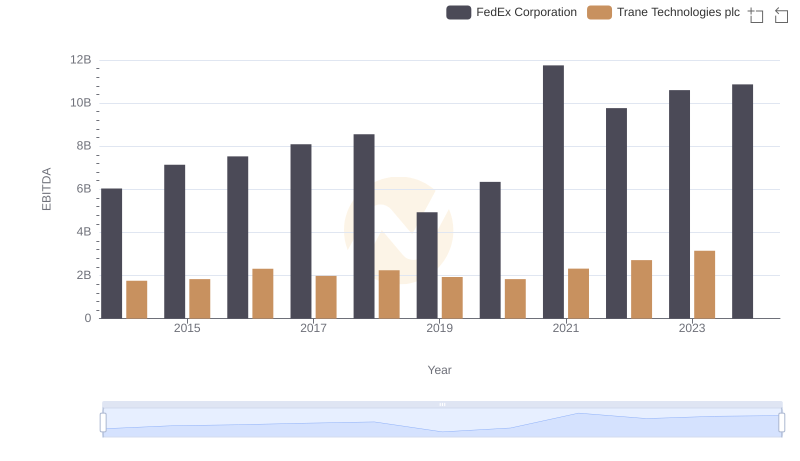
EBITDA Performance Review: Trane Technologies plc vs FedEx Corporation