| __timestamp | Thomson Reuters Corporation | Trane Technologies plc |
|---|---|---|
| Wednesday, January 1, 2014 | 9209000000 | 8982800000 |
| Thursday, January 1, 2015 | 8810000000 | 9301600000 |
| Friday, January 1, 2016 | 8232000000 | 9329300000 |
| Sunday, January 1, 2017 | 8079000000 | 9811600000 |
| Monday, January 1, 2018 | 4131000000 | 10847600000 |
| Tuesday, January 1, 2019 | 2431000000 | 11451500000 |
| Wednesday, January 1, 2020 | 2269000000 | 8651300000 |
| Friday, January 1, 2021 | 2478000000 | 9666800000 |
| Saturday, January 1, 2022 | 2408000000 | 11026900000 |
| Sunday, January 1, 2023 | 4095000000 | 11820400000 |
| Monday, January 1, 2024 | 12757700000 |
Unlocking the unknown
In the ever-evolving landscape of global business, understanding the cost of revenue is crucial for evaluating a company's efficiency and profitability. This comparison between Trane Technologies plc and Thomson Reuters Corporation from 2014 to 2023 offers a fascinating glimpse into their financial journeys.
Trane Technologies has consistently demonstrated robust growth, with its cost of revenue peaking at approximately $11.8 billion in 2023. This represents a 32% increase from 2014, showcasing its ability to scale operations efficiently.
Conversely, Thomson Reuters experienced a significant reduction in its cost of revenue, dropping by nearly 56% from 2014 to 2023. This strategic shift reflects the company's focus on optimizing its operational costs.
This decade-long analysis highlights the contrasting strategies of these two industry leaders, offering valuable insights into their operational efficiencies and market positioning.
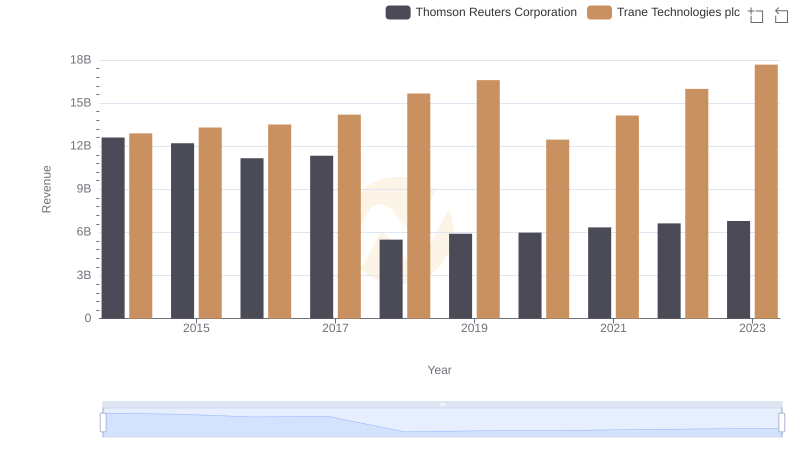
Annual Revenue Comparison: Trane Technologies plc vs Thomson Reuters Corporation
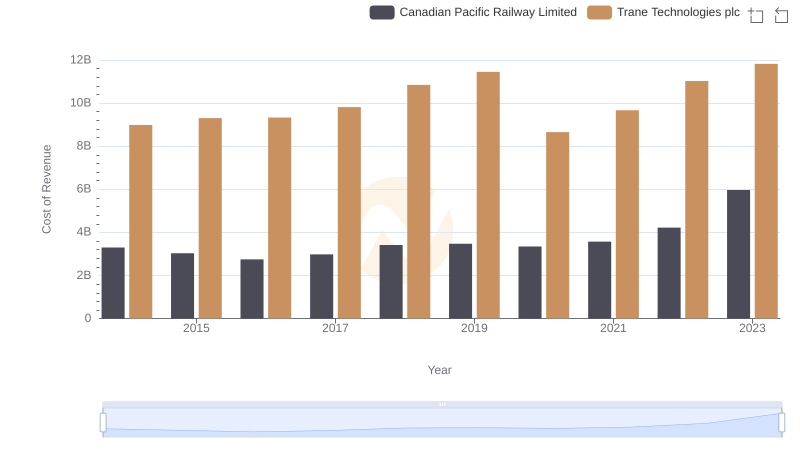
Trane Technologies plc vs Canadian Pacific Railway Limited: Efficiency in Cost of Revenue Explored
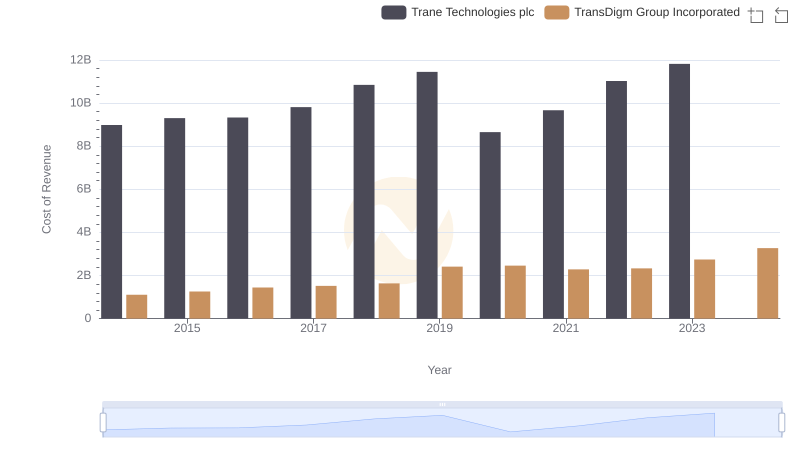
Comparing Cost of Revenue Efficiency: Trane Technologies plc vs TransDigm Group Incorporated
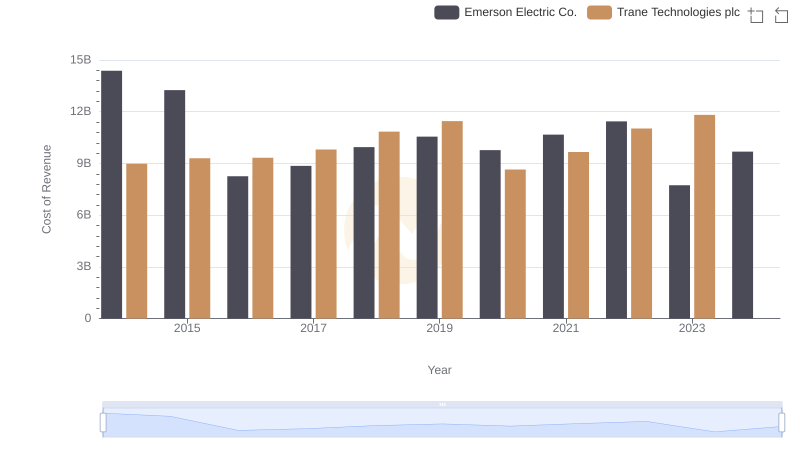
Cost of Revenue Comparison: Trane Technologies plc vs Emerson Electric Co.
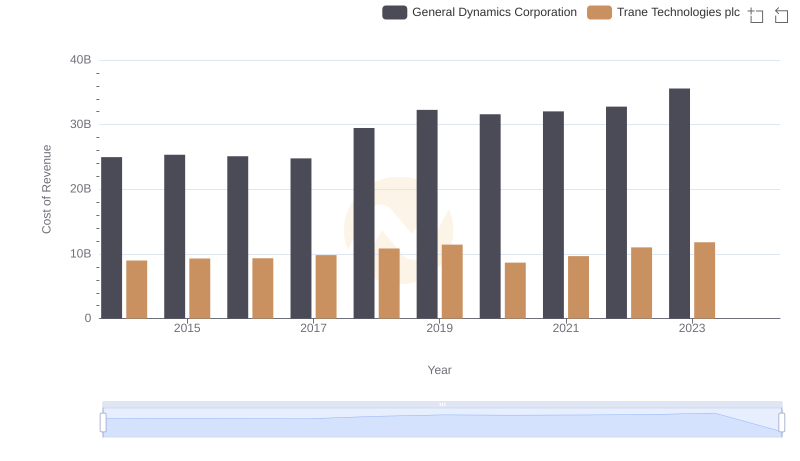
Cost of Revenue Trends: Trane Technologies plc vs General Dynamics Corporation
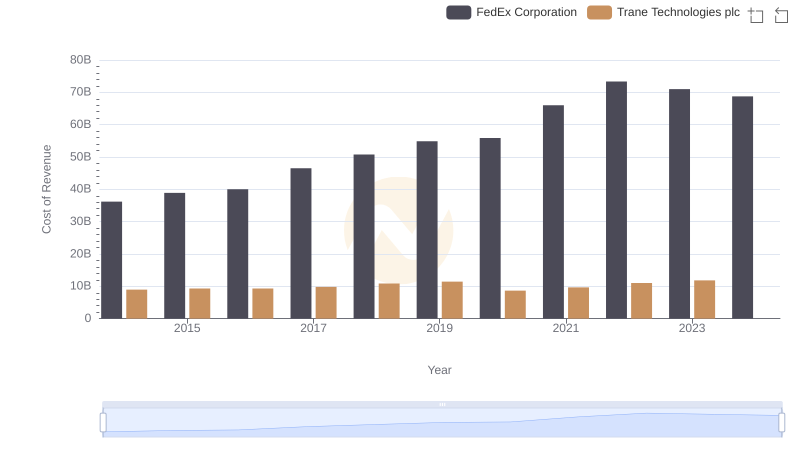
Cost of Revenue Trends: Trane Technologies plc vs FedEx Corporation
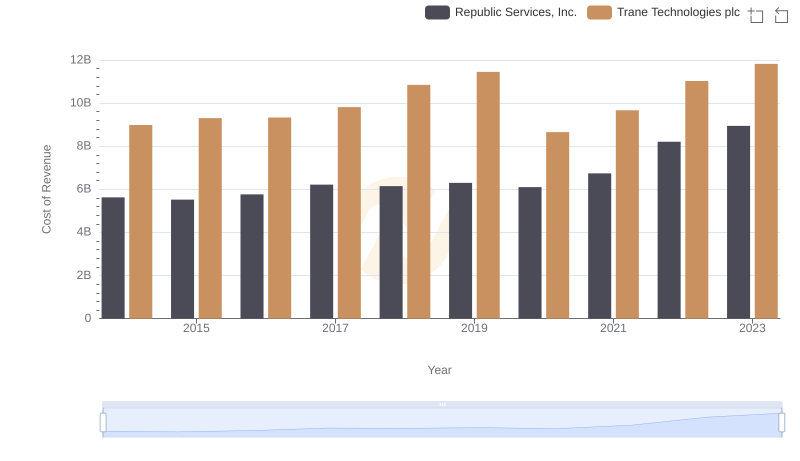
Analyzing Cost of Revenue: Trane Technologies plc and Republic Services, Inc.
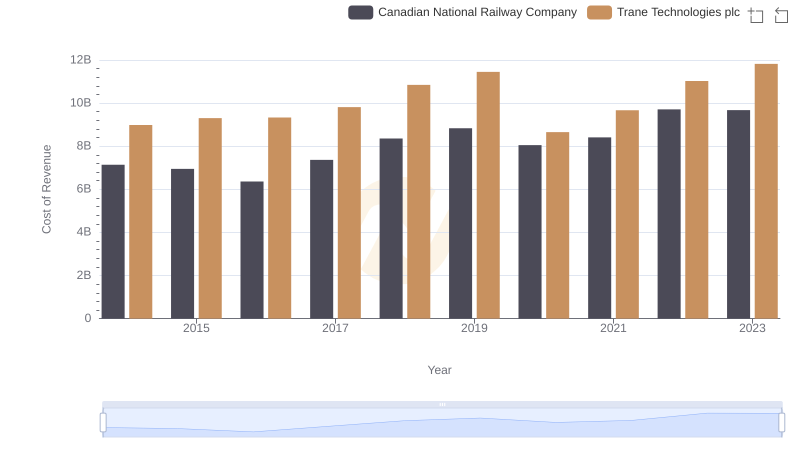
Cost of Revenue Comparison: Trane Technologies plc vs Canadian National Railway Company

Key Insights on Gross Profit: Trane Technologies plc vs Thomson Reuters Corporation
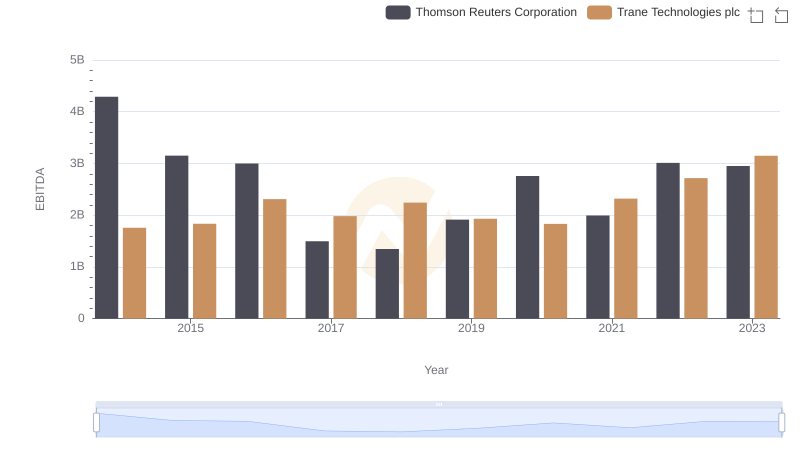
A Side-by-Side Analysis of EBITDA: Trane Technologies plc and Thomson Reuters Corporation