| __timestamp | Emerson Electric Co. | Trane Technologies plc |
|---|---|---|
| Wednesday, January 1, 2014 | 10158000000 | 3908600000 |
| Thursday, January 1, 2015 | 9048000000 | 3999100000 |
| Friday, January 1, 2016 | 6262000000 | 4179600000 |
| Sunday, January 1, 2017 | 6404000000 | 4386000000 |
| Monday, January 1, 2018 | 7460000000 | 4820600000 |
| Tuesday, January 1, 2019 | 7815000000 | 5147400000 |
| Wednesday, January 1, 2020 | 7009000000 | 3803400000 |
| Friday, January 1, 2021 | 7563000000 | 4469600000 |
| Saturday, January 1, 2022 | 8188000000 | 4964800000 |
| Sunday, January 1, 2023 | 7427000000 | 5857200000 |
| Monday, January 1, 2024 | 7808000000 | 7080500000 |
Data in motion
In the ever-evolving landscape of industrial innovation, Trane Technologies plc and Emerson Electric Co. have been pivotal players. Over the past decade, Emerson Electric has consistently outperformed Trane Technologies in terms of gross profit, with a peak in 2014 reaching approximately 10 billion USD. However, Trane Technologies has shown remarkable resilience, with its gross profit growing by nearly 50% from 2014 to 2023.
From 2014 to 2023, Emerson Electric's gross profit experienced fluctuations, with a notable dip in 2016, while Trane Technologies steadily climbed, peaking in 2023. This growth trajectory highlights Trane's strategic advancements in sustainable solutions. Despite missing data for 2024, the trends suggest a competitive landscape where both companies continue to innovate and adapt.
These insights offer a glimpse into the financial health and strategic direction of two industrial giants, providing valuable context for investors and industry enthusiasts alike.
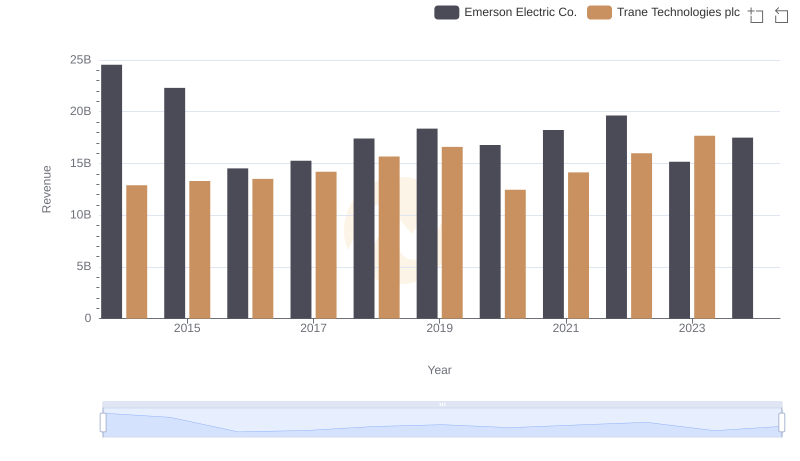
Revenue Insights: Trane Technologies plc and Emerson Electric Co. Performance Compared
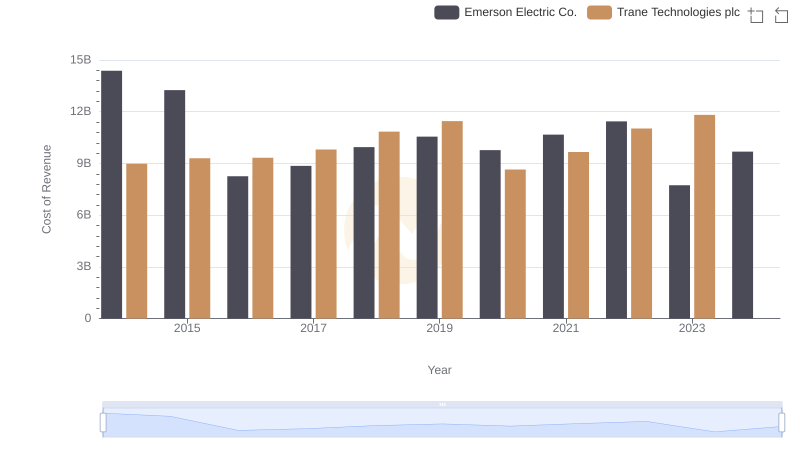
Cost of Revenue Comparison: Trane Technologies plc vs Emerson Electric Co.
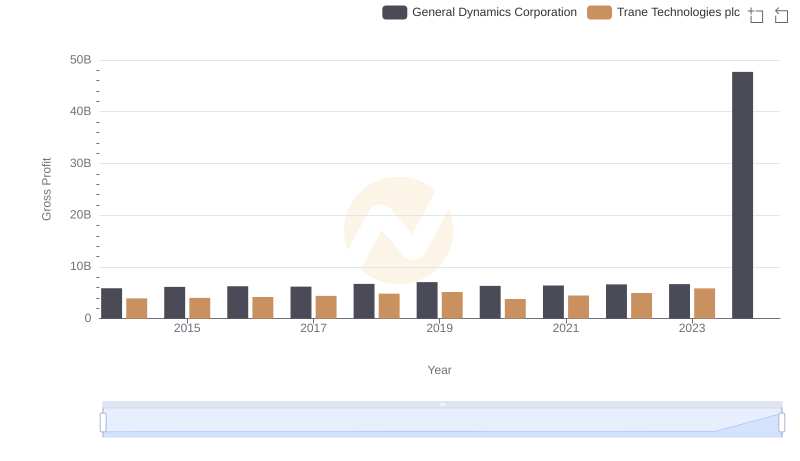
Trane Technologies plc vs General Dynamics Corporation: A Gross Profit Performance Breakdown
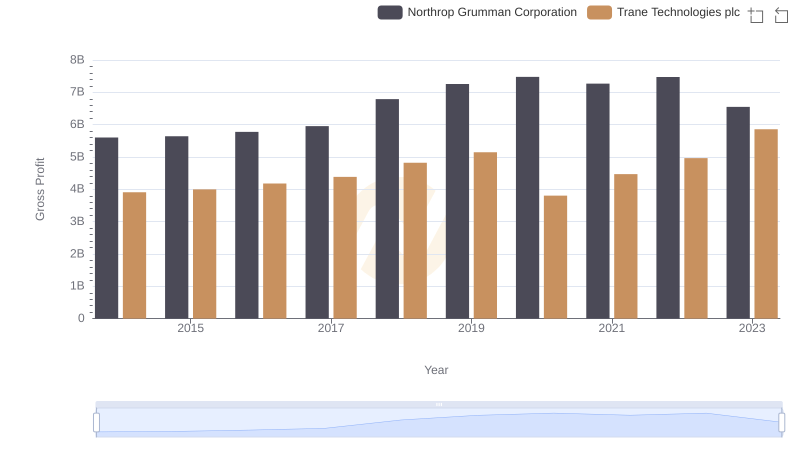
Trane Technologies plc and Northrop Grumman Corporation: A Detailed Gross Profit Analysis
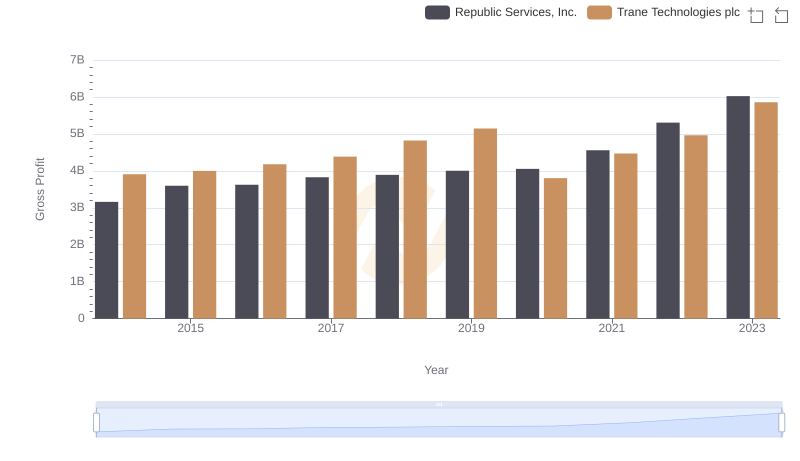
Key Insights on Gross Profit: Trane Technologies plc vs Republic Services, Inc.
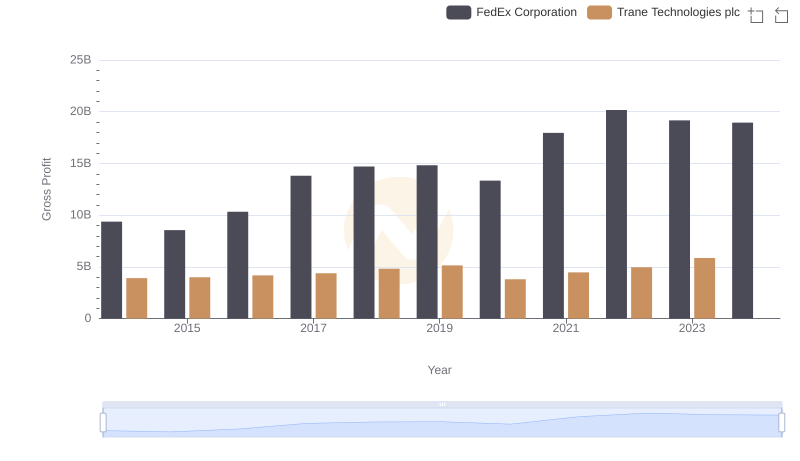
Gross Profit Trends Compared: Trane Technologies plc vs FedEx Corporation

Key Insights on Gross Profit: Trane Technologies plc vs Thomson Reuters Corporation

Gross Profit Analysis: Comparing Trane Technologies plc and Canadian National Railway Company
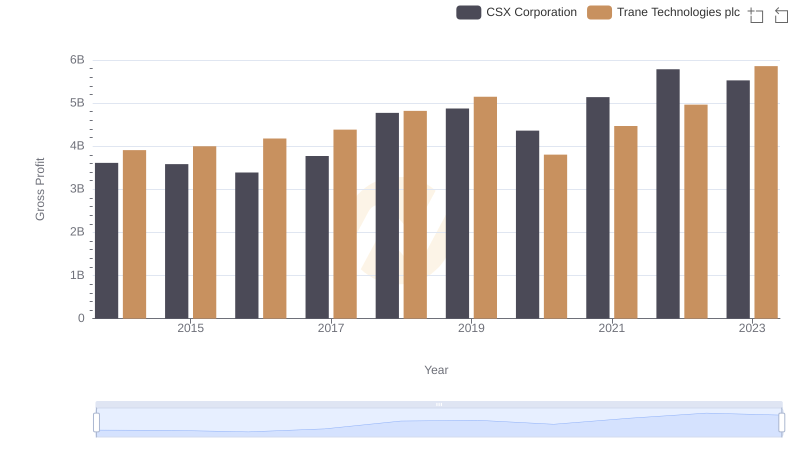
Gross Profit Trends Compared: Trane Technologies plc vs CSX Corporation
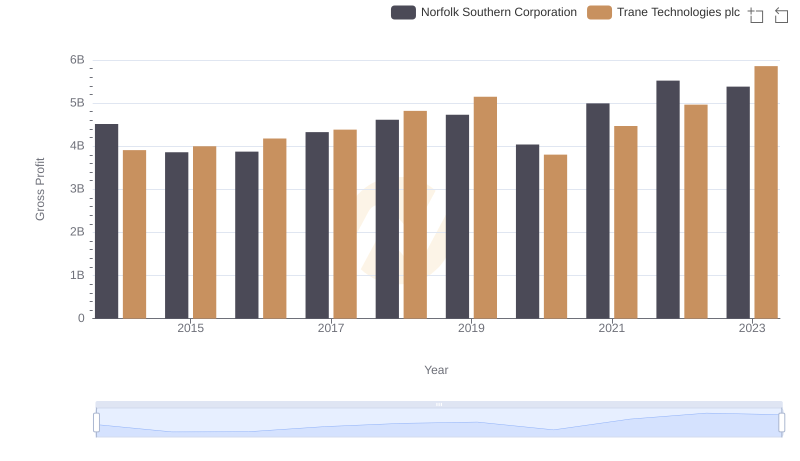
Trane Technologies plc and Norfolk Southern Corporation: A Detailed Gross Profit Analysis
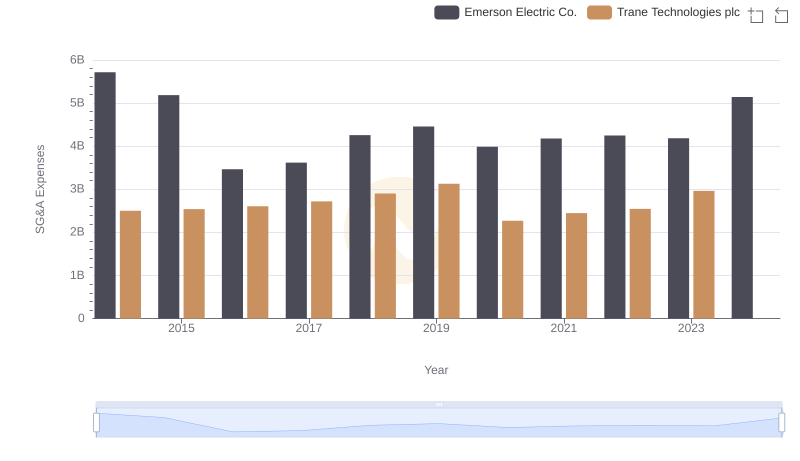
Operational Costs Compared: SG&A Analysis of Trane Technologies plc and Emerson Electric Co.
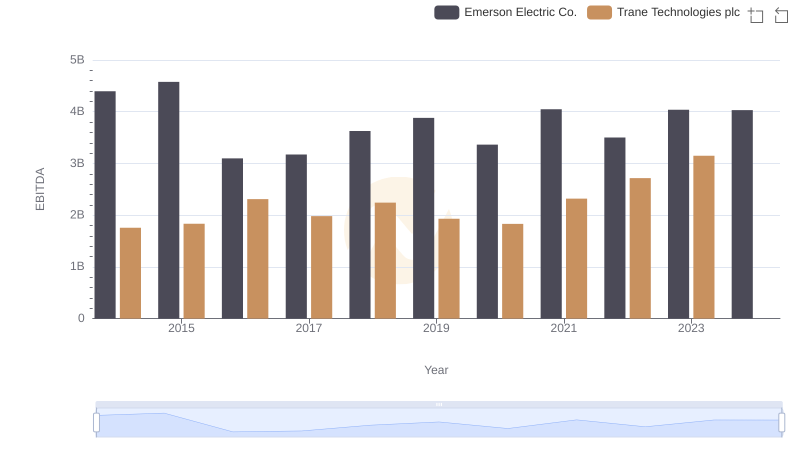
Comparative EBITDA Analysis: Trane Technologies plc vs Emerson Electric Co.