| __timestamp | General Dynamics Corporation | Trane Technologies plc |
|---|---|---|
| Wednesday, January 1, 2014 | 24979000000 | 8982800000 |
| Thursday, January 1, 2015 | 25339000000 | 9301600000 |
| Friday, January 1, 2016 | 25104000000 | 9329300000 |
| Sunday, January 1, 2017 | 24786000000 | 9811600000 |
| Monday, January 1, 2018 | 29478000000 | 10847600000 |
| Tuesday, January 1, 2019 | 32291000000 | 11451500000 |
| Wednesday, January 1, 2020 | 31600000000 | 8651300000 |
| Friday, January 1, 2021 | 32061000000 | 9666800000 |
| Saturday, January 1, 2022 | 32785000000 | 11026900000 |
| Sunday, January 1, 2023 | 35600000000 | 11820400000 |
| Monday, January 1, 2024 | 40352000000 | 12757700000 |
Unleashing the power of data
In the ever-evolving landscape of industrial giants, understanding cost dynamics is crucial. Trane Technologies plc and General Dynamics Corporation, two stalwarts in their respective fields, have shown intriguing trends in their cost of revenue over the past decade. From 2014 to 2023, General Dynamics consistently maintained a higher cost of revenue, peaking in 2023 with a 42% increase from 2014. In contrast, Trane Technologies exhibited a more stable trajectory, with a notable 32% rise in 2023 compared to 2014. The data reveals a significant dip for Trane in 2020, likely reflecting global economic challenges. As we look to the future, these trends offer valuable insights into the operational efficiencies and strategic priorities of these corporations. Missing data for 2024 suggests a need for further analysis to predict future trends.
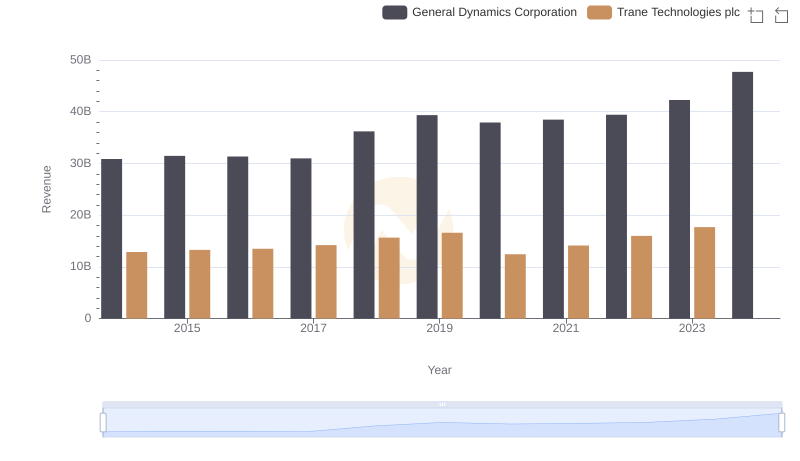
Trane Technologies plc vs General Dynamics Corporation: Annual Revenue Growth Compared
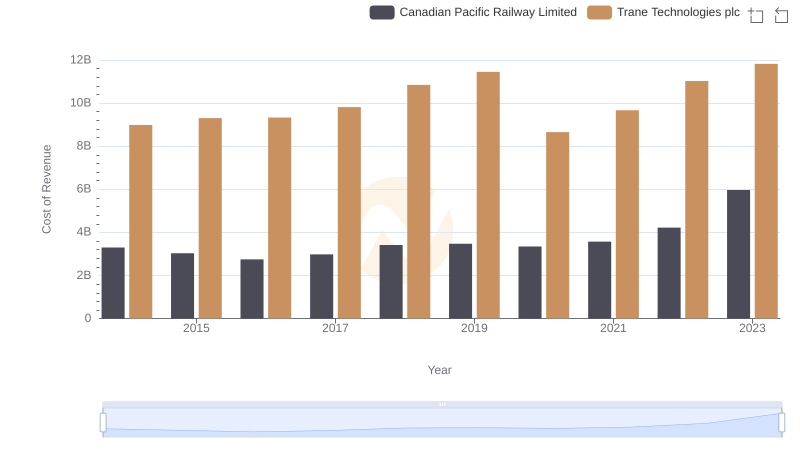
Trane Technologies plc vs Canadian Pacific Railway Limited: Efficiency in Cost of Revenue Explored
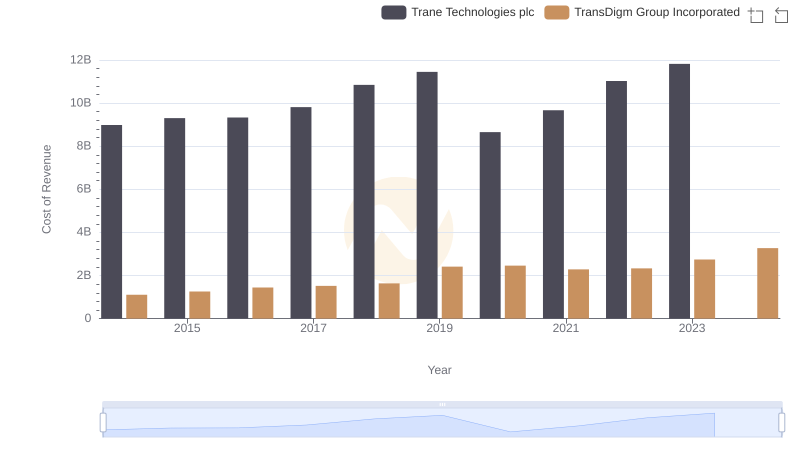
Comparing Cost of Revenue Efficiency: Trane Technologies plc vs TransDigm Group Incorporated
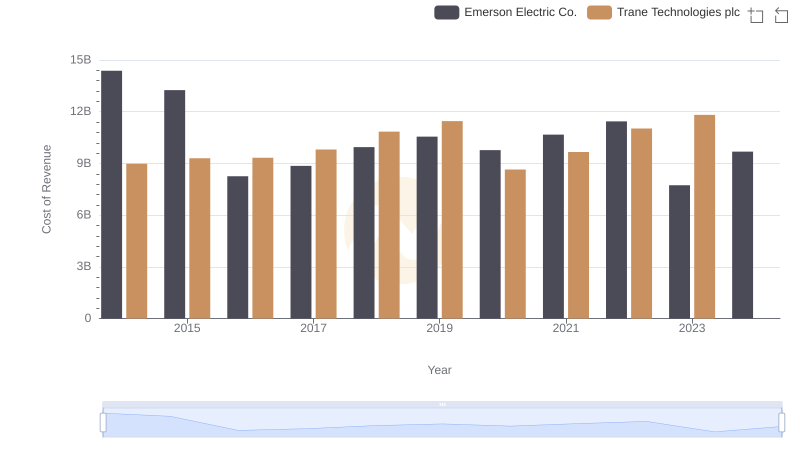
Cost of Revenue Comparison: Trane Technologies plc vs Emerson Electric Co.
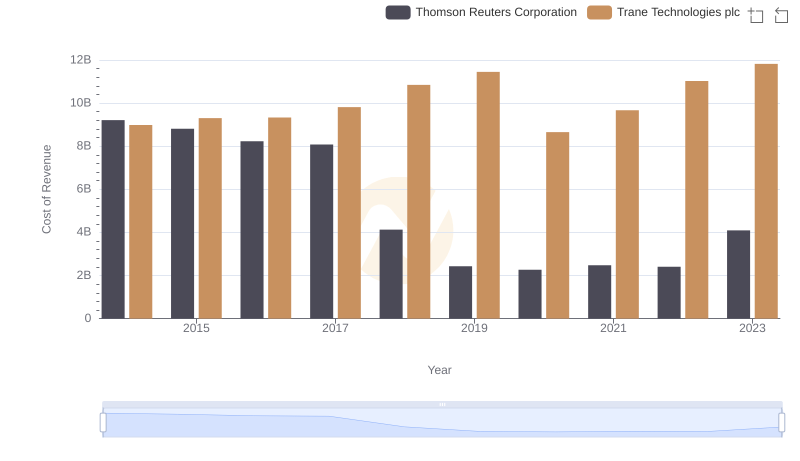
Cost of Revenue Comparison: Trane Technologies plc vs Thomson Reuters Corporation
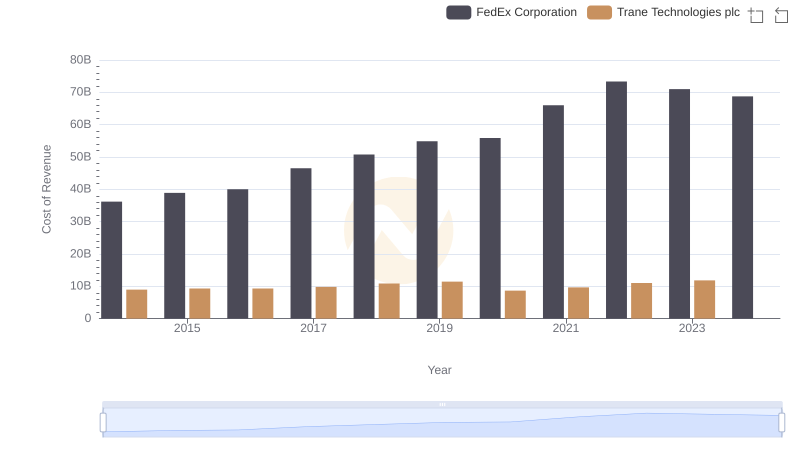
Cost of Revenue Trends: Trane Technologies plc vs FedEx Corporation
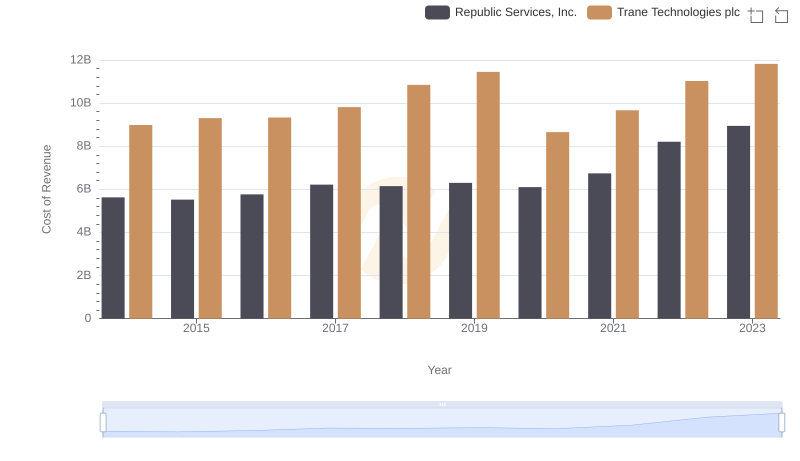
Analyzing Cost of Revenue: Trane Technologies plc and Republic Services, Inc.
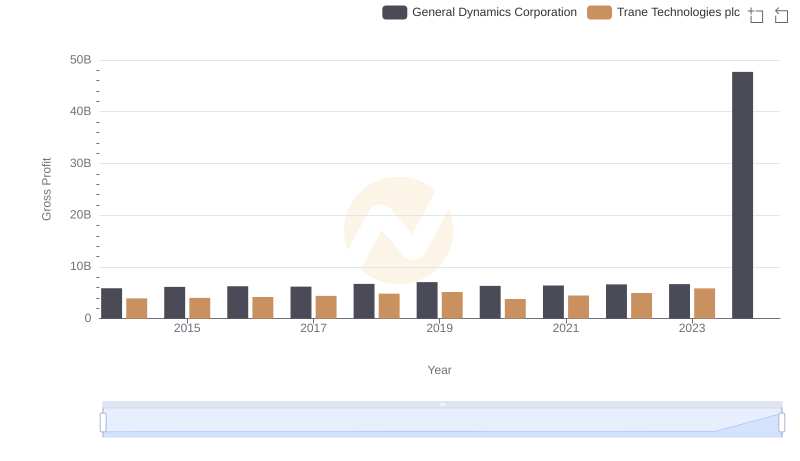
Trane Technologies plc vs General Dynamics Corporation: A Gross Profit Performance Breakdown
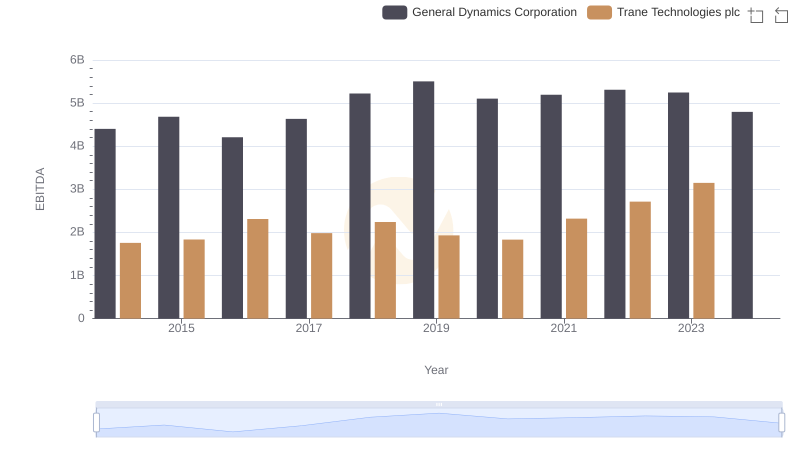
Professional EBITDA Benchmarking: Trane Technologies plc vs General Dynamics Corporation