| __timestamp | Canadian Pacific Railway Limited | Trane Technologies plc |
|---|---|---|
| Wednesday, January 1, 2014 | 3300000000 | 8982800000 |
| Thursday, January 1, 2015 | 3032000000 | 9301600000 |
| Friday, January 1, 2016 | 2749000000 | 9329300000 |
| Sunday, January 1, 2017 | 2979000000 | 9811600000 |
| Monday, January 1, 2018 | 3413000000 | 10847600000 |
| Tuesday, January 1, 2019 | 3475000000 | 11451500000 |
| Wednesday, January 1, 2020 | 3349000000 | 8651300000 |
| Friday, January 1, 2021 | 3571000000 | 9666800000 |
| Saturday, January 1, 2022 | 4223000000 | 11026900000 |
| Sunday, January 1, 2023 | 5968000000 | 11820400000 |
| Monday, January 1, 2024 | 7003000000 | 12757700000 |
Unleashing insights
In the ever-evolving landscape of corporate efficiency, understanding cost management is crucial. This analysis delves into the cost of revenue trends for Trane Technologies plc and Canadian Pacific Railway Limited from 2014 to 2023. Over this period, Trane Technologies consistently reported higher costs, peaking at approximately $11.8 billion in 2023, reflecting a 32% increase from 2014. In contrast, Canadian Pacific Railway's cost of revenue surged by 81% over the same period, reaching nearly $6 billion in 2023. This stark difference highlights Trane's larger scale and operational complexity compared to Canadian Pacific's more streamlined operations. The data underscores the importance of strategic cost management in maintaining competitive advantage. As businesses navigate the challenges of the modern economy, these insights offer valuable lessons in balancing growth with efficiency.
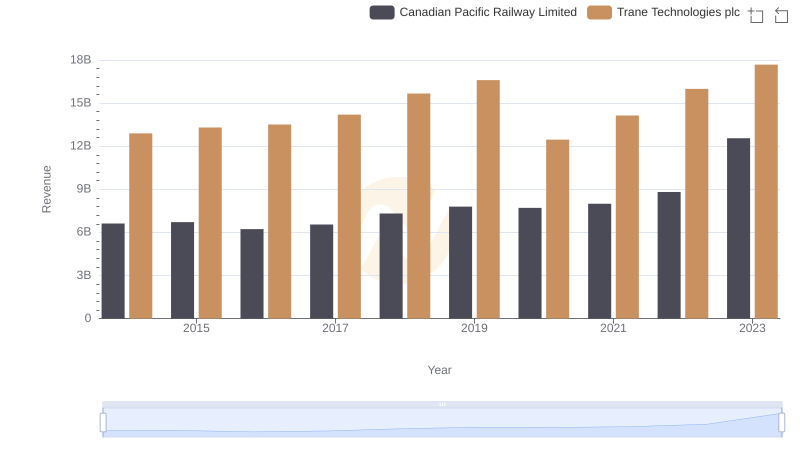
Revenue Showdown: Trane Technologies plc vs Canadian Pacific Railway Limited
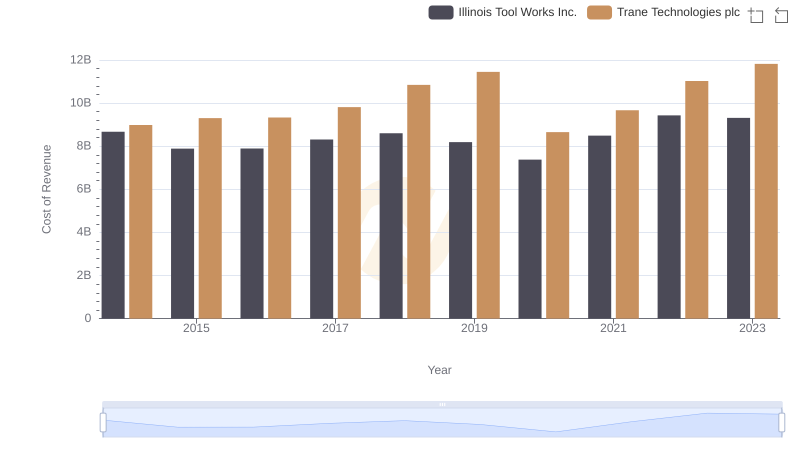
Trane Technologies plc vs Illinois Tool Works Inc.: Efficiency in Cost of Revenue Explored
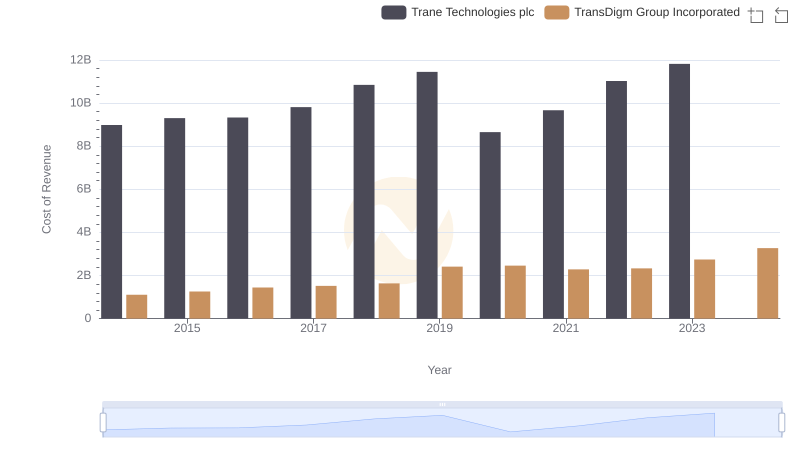
Comparing Cost of Revenue Efficiency: Trane Technologies plc vs TransDigm Group Incorporated
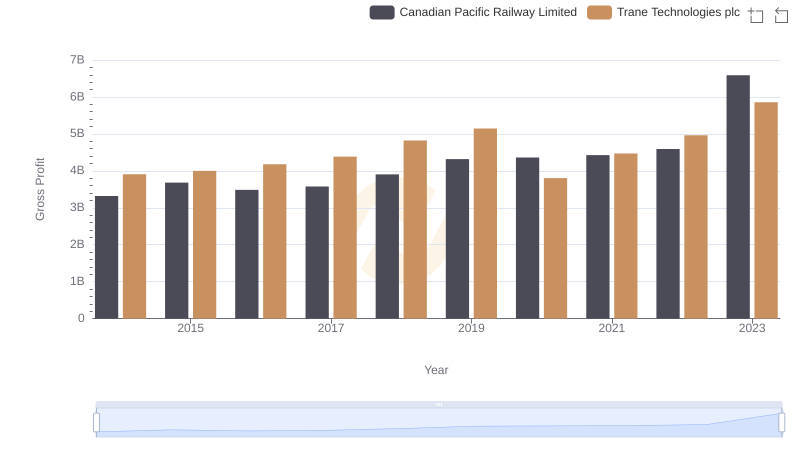
Gross Profit Trends Compared: Trane Technologies plc vs Canadian Pacific Railway Limited
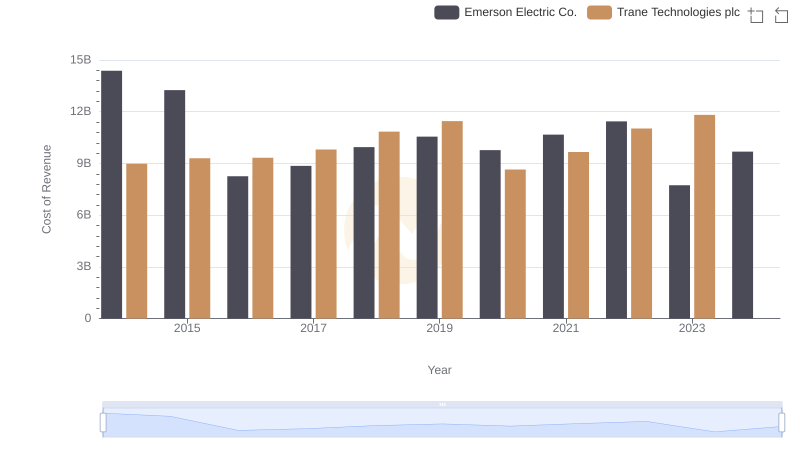
Cost of Revenue Comparison: Trane Technologies plc vs Emerson Electric Co.
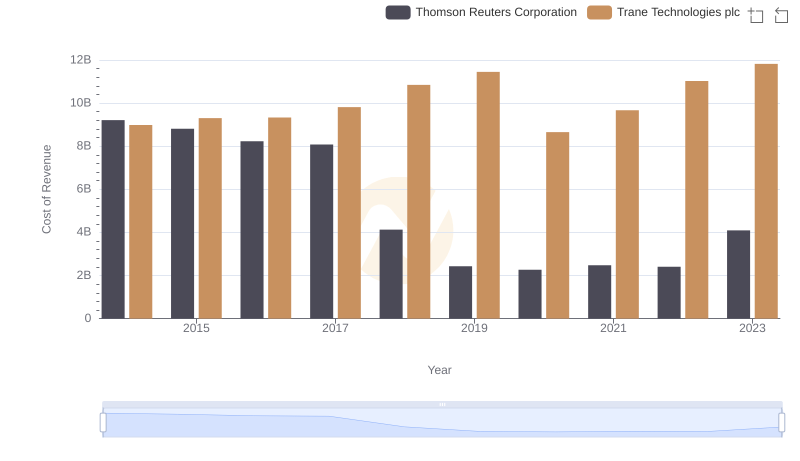
Cost of Revenue Comparison: Trane Technologies plc vs Thomson Reuters Corporation
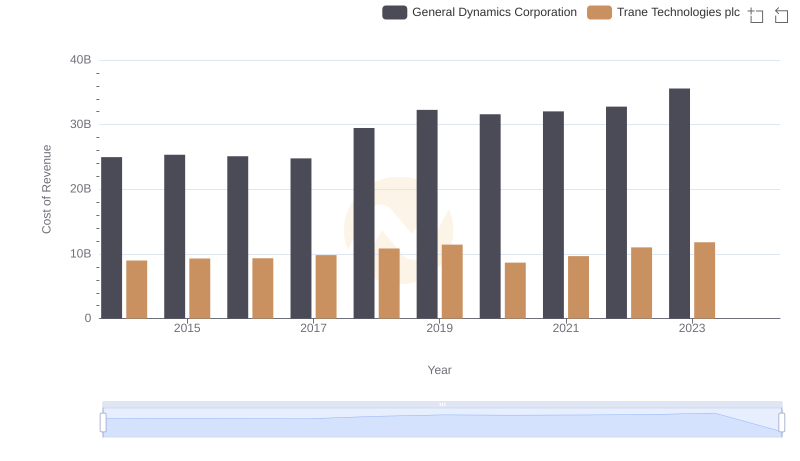
Cost of Revenue Trends: Trane Technologies plc vs General Dynamics Corporation
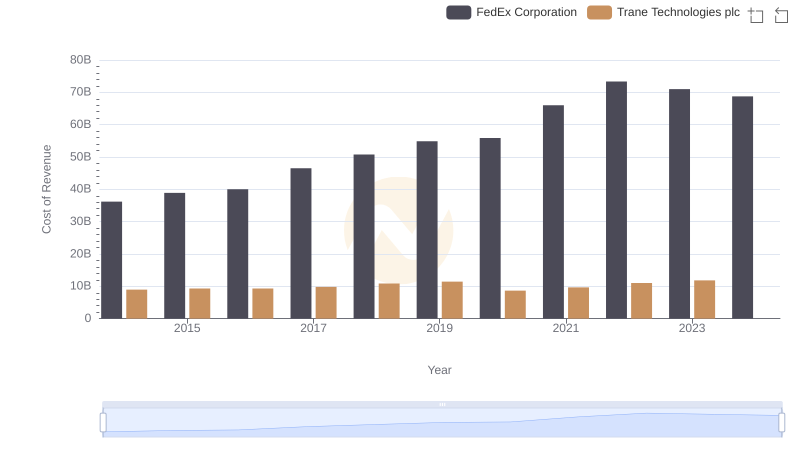
Cost of Revenue Trends: Trane Technologies plc vs FedEx Corporation
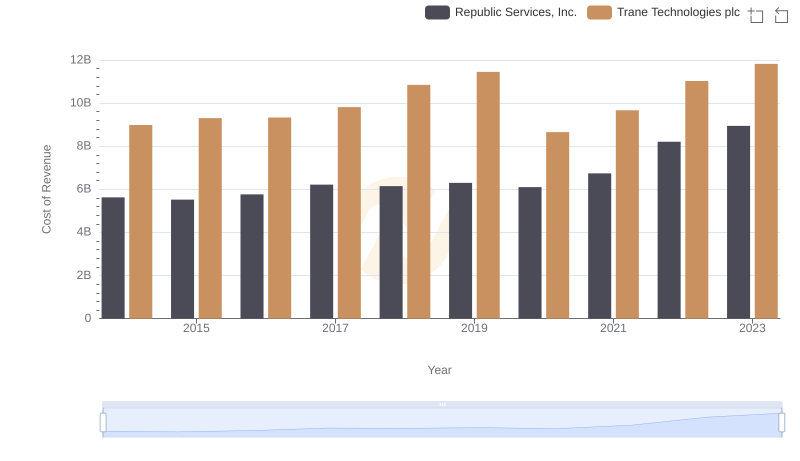
Analyzing Cost of Revenue: Trane Technologies plc and Republic Services, Inc.
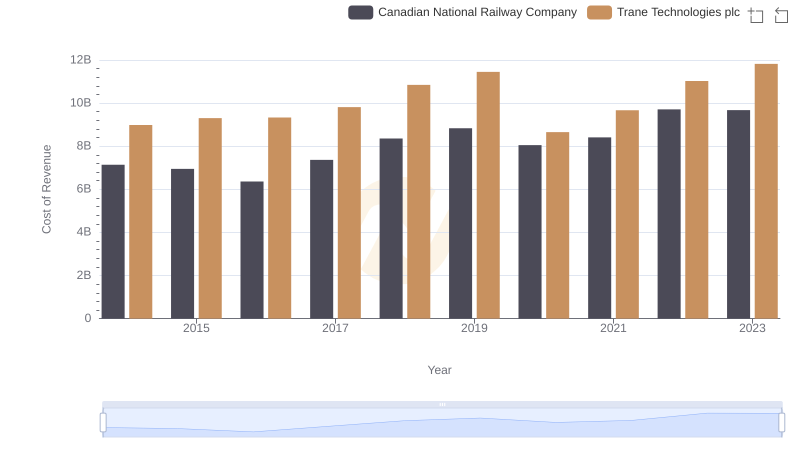
Cost of Revenue Comparison: Trane Technologies plc vs Canadian National Railway Company