| __timestamp | Jacobs Engineering Group Inc. | United Rentals, Inc. |
|---|---|---|
| Wednesday, January 1, 2014 | 12695157000 | 5685000000 |
| Thursday, January 1, 2015 | 12114832000 | 5817000000 |
| Friday, January 1, 2016 | 10964157000 | 5762000000 |
| Sunday, January 1, 2017 | 10022788000 | 6641000000 |
| Monday, January 1, 2018 | 14984646000 | 8047000000 |
| Tuesday, January 1, 2019 | 12737868000 | 9351000000 |
| Wednesday, January 1, 2020 | 13566975000 | 8530000000 |
| Friday, January 1, 2021 | 14092632000 | 9716000000 |
| Saturday, January 1, 2022 | 14922825000 | 11642000000 |
| Sunday, January 1, 2023 | 16352414000 | 14332000000 |
| Monday, January 1, 2024 | 11500941000 | 15345000000 |
Unleashing the power of data
In the ever-evolving landscape of industrial services, United Rentals, Inc. and Jacobs Engineering Group Inc. have been pivotal players. Over the past decade, from 2014 to 2024, these giants have showcased contrasting revenue trajectories. United Rentals has seen a remarkable growth, with its revenue surging by approximately 170% from 2014 to 2024. This growth is particularly notable in the post-pandemic era, where the company’s revenue jumped from around $9.7 billion in 2021 to $15.3 billion in 2024, marking a 58% increase.
Conversely, Jacobs Engineering experienced a more fluctuating path. Despite a peak in 2023 with revenues reaching $16.4 billion, the company faced a downturn in 2024, dropping to $11.5 billion. This decline highlights the volatile nature of the engineering sector, influenced by global economic shifts and project cycles. As these companies navigate future challenges, their strategic adaptations will be crucial.
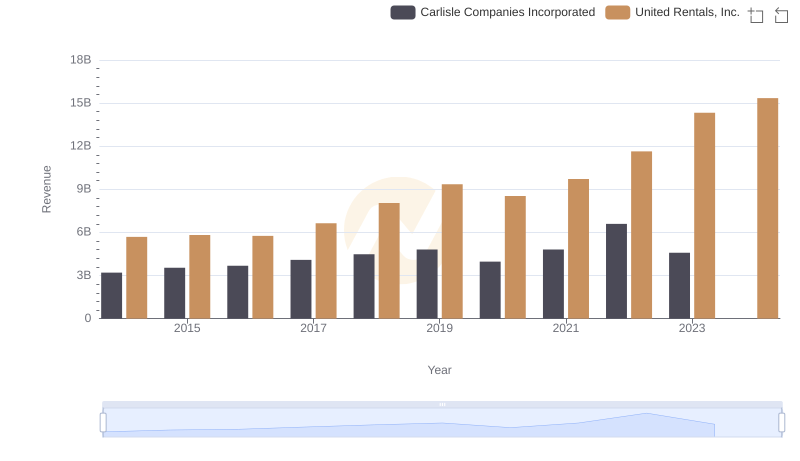
Annual Revenue Comparison: United Rentals, Inc. vs Carlisle Companies Incorporated
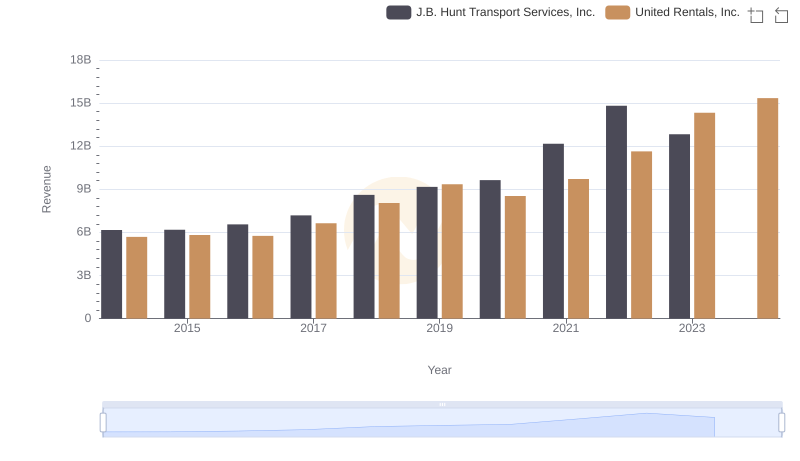
United Rentals, Inc. vs J.B. Hunt Transport Services, Inc.: Examining Key Revenue Metrics
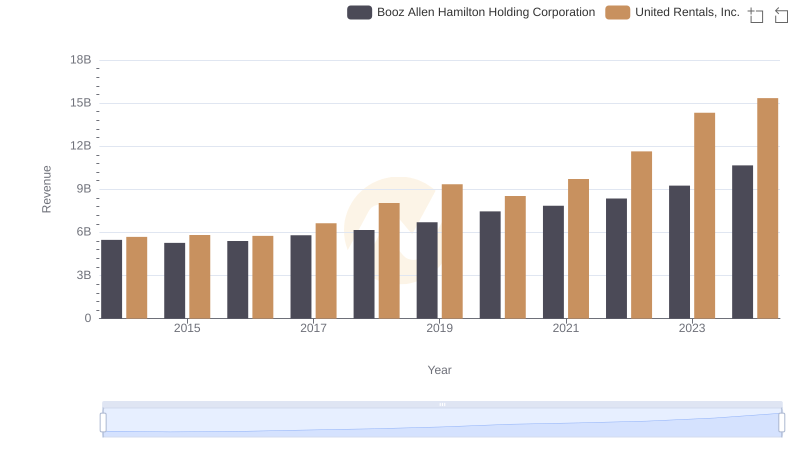
United Rentals, Inc. and Booz Allen Hamilton Holding Corporation: A Comprehensive Revenue Analysis
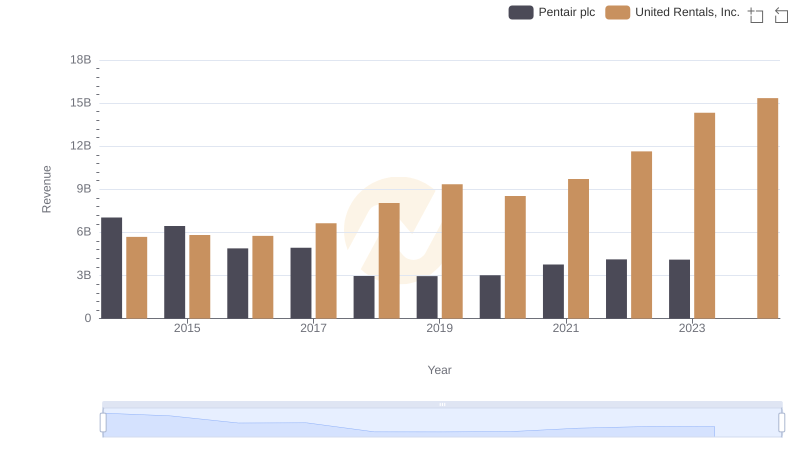
Revenue Showdown: United Rentals, Inc. vs Pentair plc
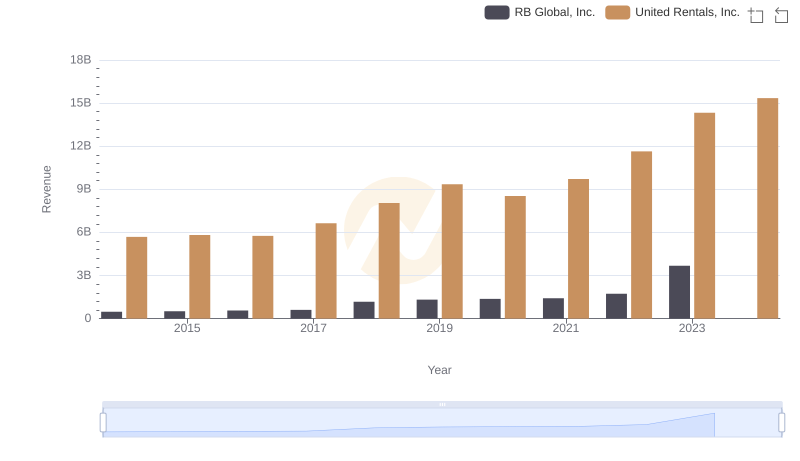
Revenue Insights: United Rentals, Inc. and RB Global, Inc. Performance Compared
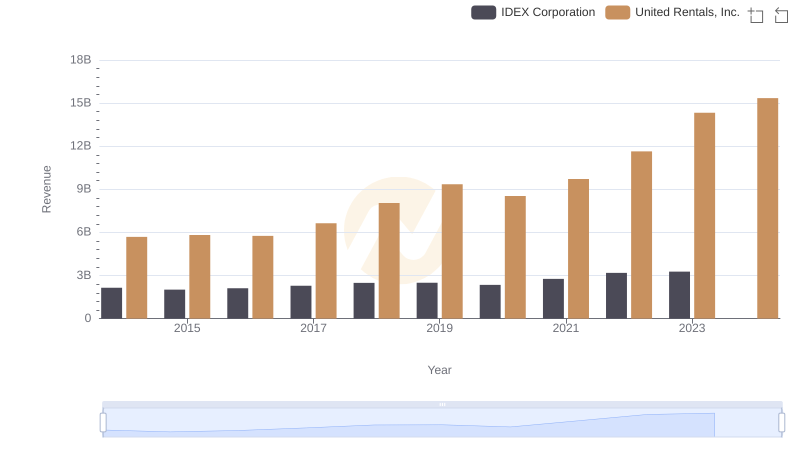
United Rentals, Inc. and IDEX Corporation: A Comprehensive Revenue Analysis
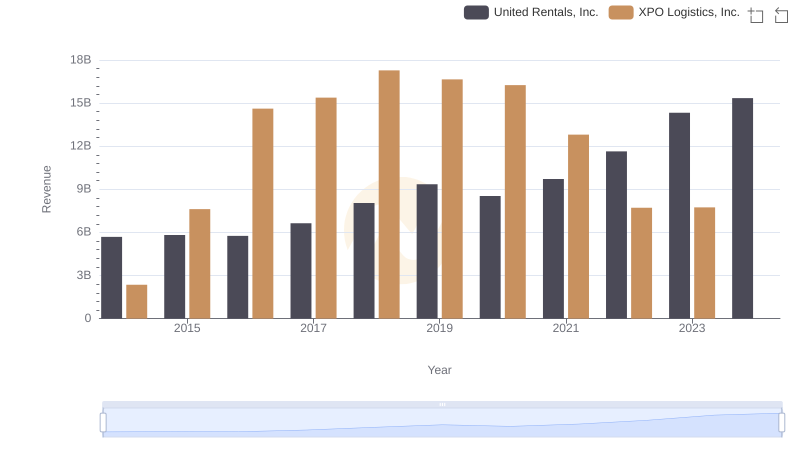
United Rentals, Inc. and XPO Logistics, Inc.: A Comprehensive Revenue Analysis
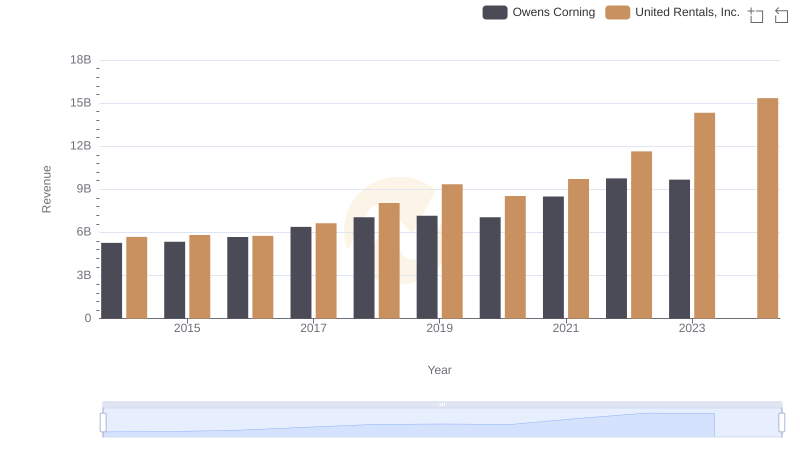
United Rentals, Inc. vs Owens Corning: Annual Revenue Growth Compared
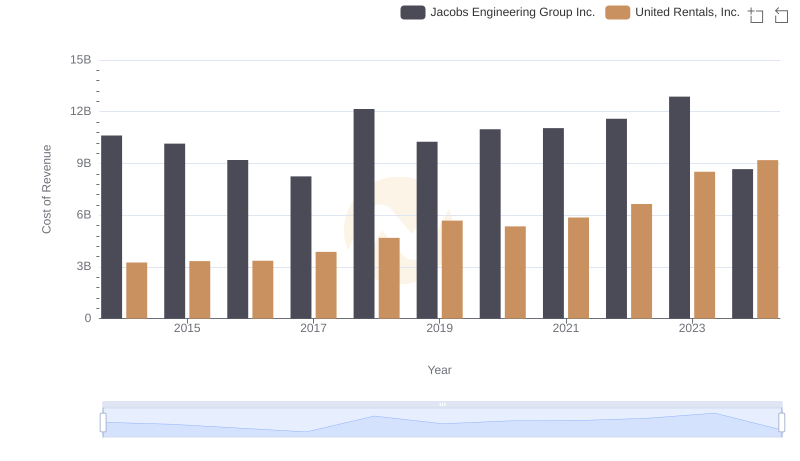
Cost Insights: Breaking Down United Rentals, Inc. and Jacobs Engineering Group Inc.'s Expenses
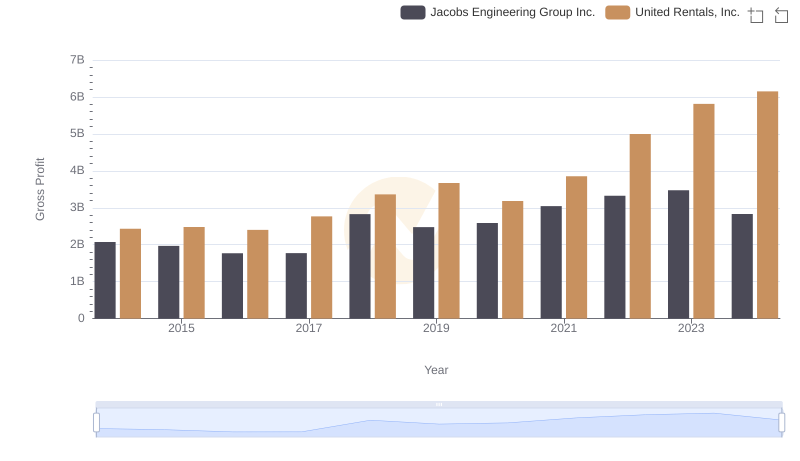
United Rentals, Inc. and Jacobs Engineering Group Inc.: A Detailed Gross Profit Analysis
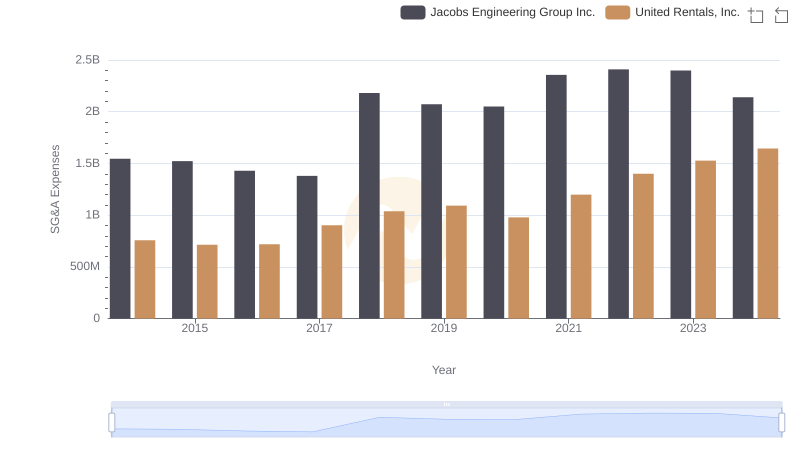
Who Optimizes SG&A Costs Better? United Rentals, Inc. or Jacobs Engineering Group Inc.
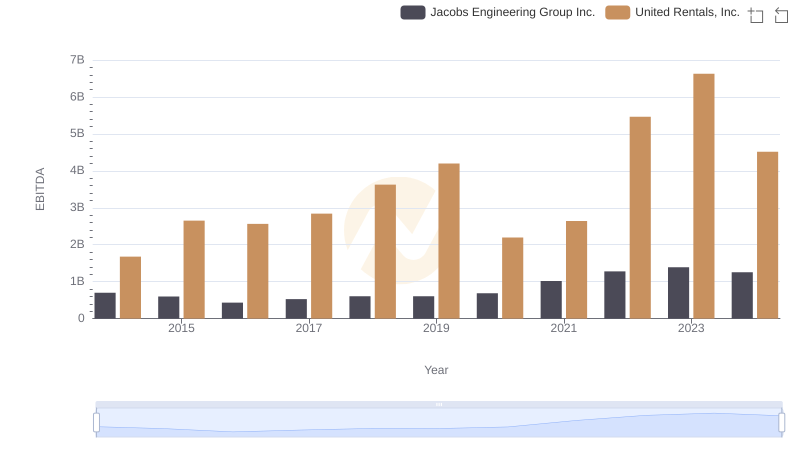
EBITDA Performance Review: United Rentals, Inc. vs Jacobs Engineering Group Inc.