| __timestamp | Jacobs Engineering Group Inc. | United Rentals, Inc. |
|---|---|---|
| Wednesday, January 1, 2014 | 699015000 | 1678000000 |
| Thursday, January 1, 2015 | 598932000 | 2653000000 |
| Friday, January 1, 2016 | 431954000 | 2566000000 |
| Sunday, January 1, 2017 | 527765000 | 2843000000 |
| Monday, January 1, 2018 | 606328000 | 3628000000 |
| Tuesday, January 1, 2019 | 604075000 | 4200000000 |
| Wednesday, January 1, 2020 | 685042000 | 2195000000 |
| Friday, January 1, 2021 | 1019116000 | 2642000000 |
| Saturday, January 1, 2022 | 1277649000 | 5464000000 |
| Sunday, January 1, 2023 | 1392039000 | 6627000000 |
| Monday, January 1, 2024 | 1255083000 | 4516000000 |
Unveiling the hidden dimensions of data
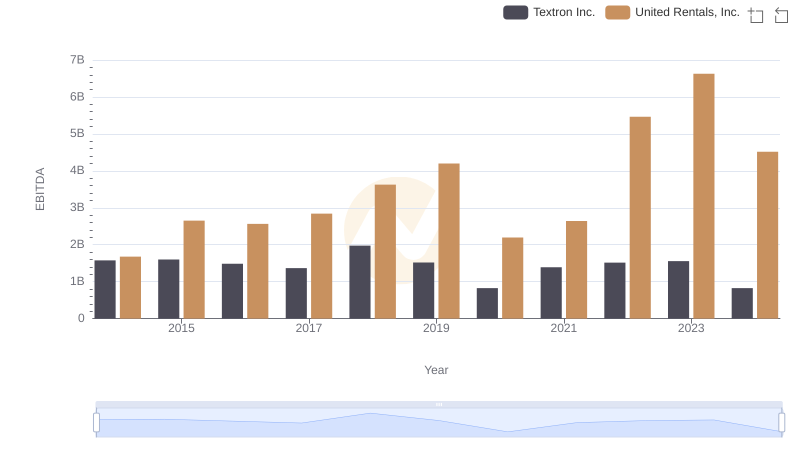
In the competitive landscape of industrial services, United Rentals, Inc. and Jacobs Engineering Group Inc. have showcased distinct EBITDA trajectories from 2014 to 2024. United Rentals, Inc. has consistently outperformed, with a staggering 295% increase in EBITDA, peaking at approximately $6.6 billion in 2023. This growth underscores their strategic expansions and robust market positioning.
Conversely, Jacobs Engineering Group Inc. has demonstrated a more modest growth, with a 99% increase over the same period, reaching its zenith in 2023 with an EBITDA of around $1.4 billion. This reflects their steady, albeit slower, adaptation to market demands.
The data reveals a compelling narrative of resilience and strategic foresight, with United Rentals, Inc. capitalizing on market opportunities more aggressively. As we look to the future, these trends offer valuable insights into the evolving dynamics of the industrial services sector.
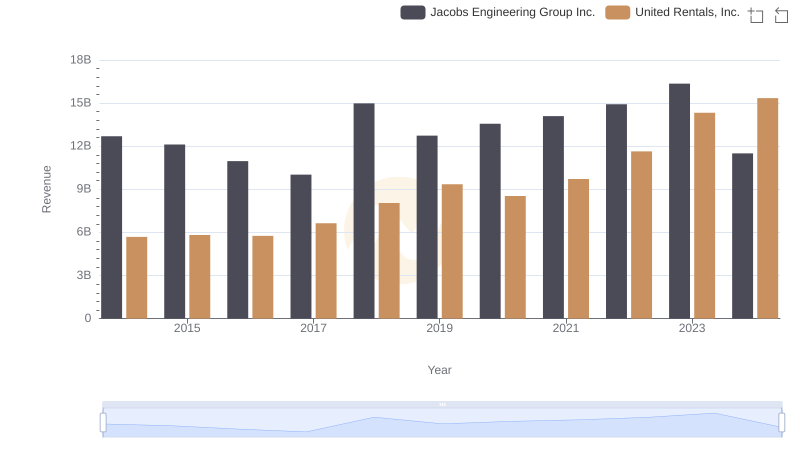
United Rentals, Inc. vs Jacobs Engineering Group Inc.: Annual Revenue Growth Compared
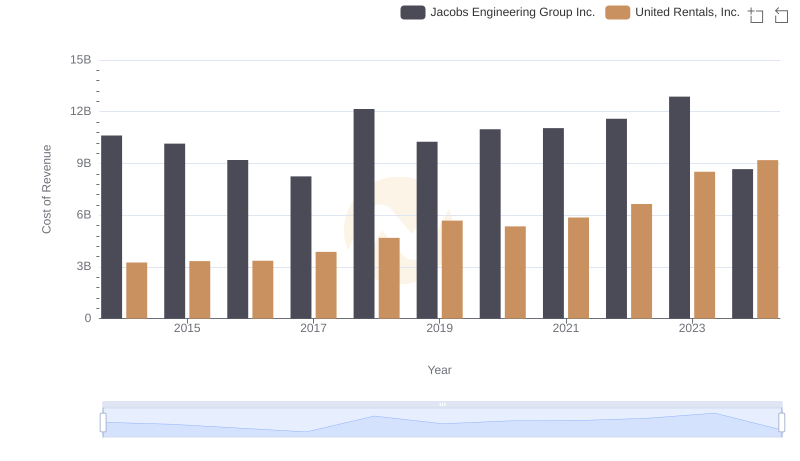
Cost Insights: Breaking Down United Rentals, Inc. and Jacobs Engineering Group Inc.'s Expenses
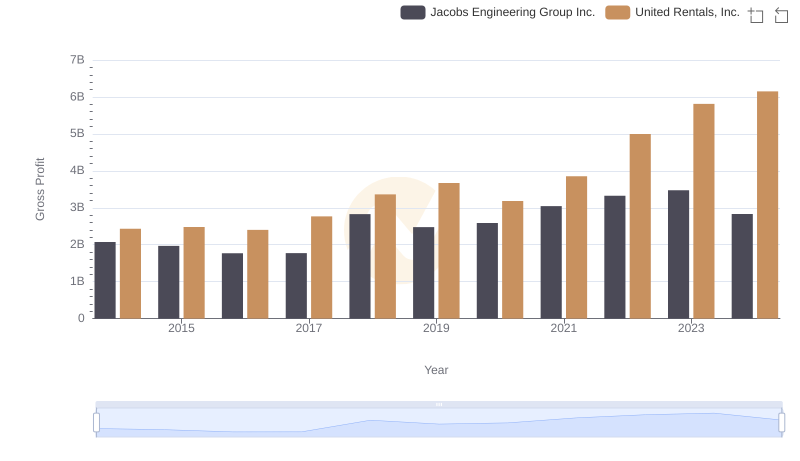
United Rentals, Inc. and Jacobs Engineering Group Inc.: A Detailed Gross Profit Analysis
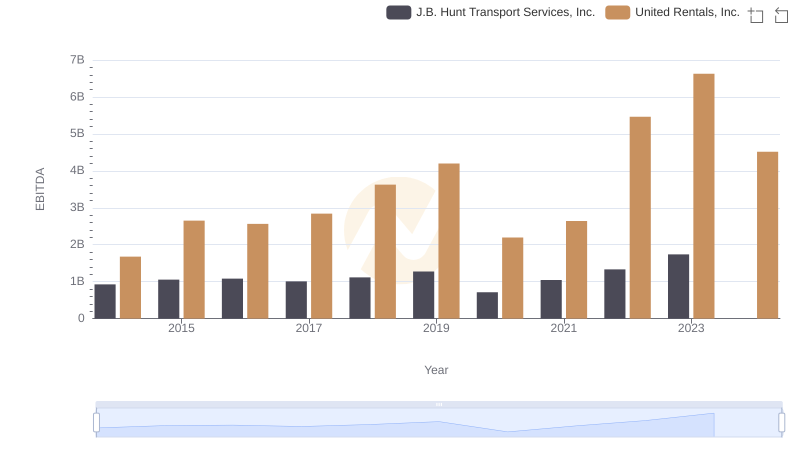
EBITDA Analysis: Evaluating United Rentals, Inc. Against J.B. Hunt Transport Services, Inc.
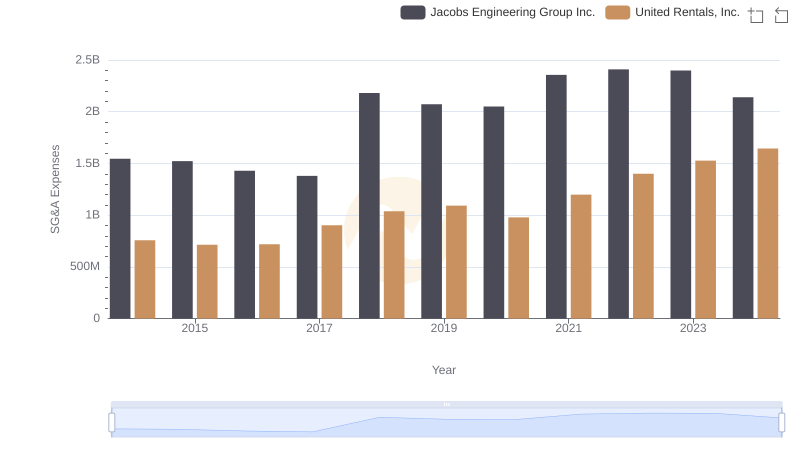
Who Optimizes SG&A Costs Better? United Rentals, Inc. or Jacobs Engineering Group Inc.
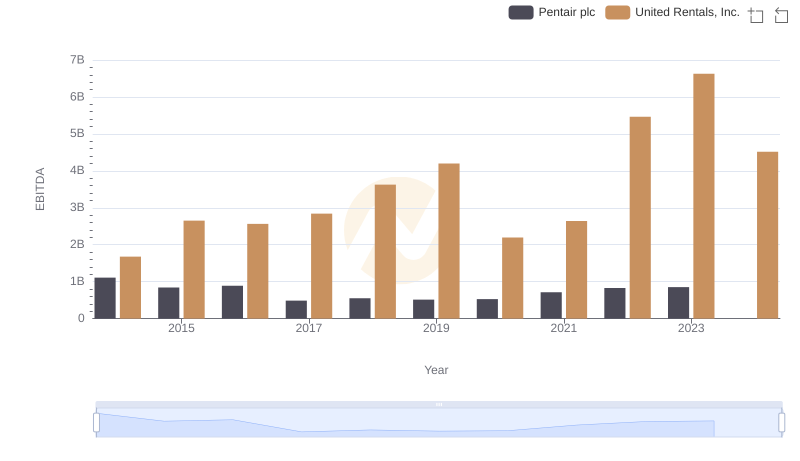
Comprehensive EBITDA Comparison: United Rentals, Inc. vs Pentair plc

Comparative EBITDA Analysis: United Rentals, Inc. vs IDEX Corporation
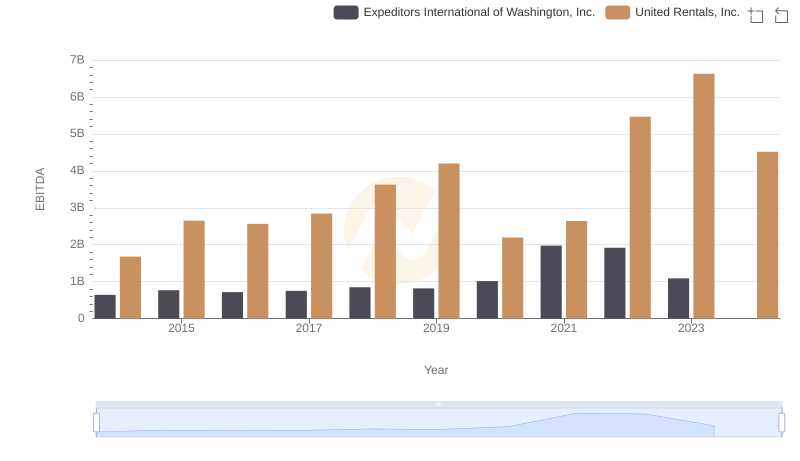
A Side-by-Side Analysis of EBITDA: United Rentals, Inc. and Expeditors International of Washington, Inc.

United Rentals, Inc. vs Owens Corning: In-Depth EBITDA Performance Comparison
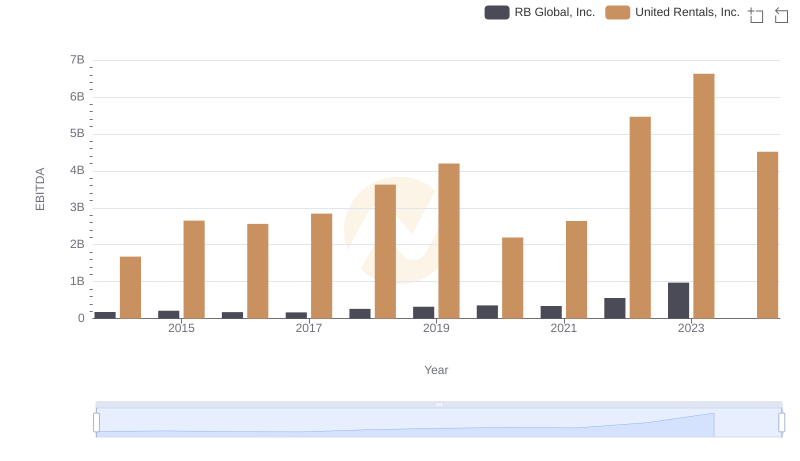
Comprehensive EBITDA Comparison: United Rentals, Inc. vs RB Global, Inc.
United Rentals, Inc. vs Textron Inc.: In-Depth EBITDA Performance Comparison