| __timestamp | AerCap Holdings N.V. | United Rentals, Inc. |
|---|---|---|
| Wednesday, January 1, 2014 | 3535797000 | 5685000000 |
| Thursday, January 1, 2015 | 5598662000 | 5817000000 |
| Friday, January 1, 2016 | 5152131000 | 5762000000 |
| Sunday, January 1, 2017 | 5037493000 | 6641000000 |
| Monday, January 1, 2018 | 4799980000 | 8047000000 |
| Tuesday, January 1, 2019 | 4937340000 | 9351000000 |
| Wednesday, January 1, 2020 | 4493629000 | 8530000000 |
| Friday, January 1, 2021 | 4588930000 | 9716000000 |
| Saturday, January 1, 2022 | 6914985000 | 11642000000 |
| Sunday, January 1, 2023 | 7574664000 | 14332000000 |
| Monday, January 1, 2024 | 15345000000 |
Infusing magic into the data realm
In the dynamic world of corporate growth, United Rentals, Inc. and AerCap Holdings N.V. have carved distinct paths over the past decade. From 2014 to 2023, United Rentals has consistently outpaced AerCap in revenue growth, showcasing a robust upward trajectory. By 2023, United Rentals' revenue surged to approximately $14.3 billion, marking a remarkable 152% increase from its 2014 figures. In contrast, AerCap Holdings experienced a more modest growth, with its revenue reaching around $7.6 billion in 2023, reflecting a 114% rise since 2014.
This comparison highlights United Rentals' strategic expansion and market dominance, particularly in the equipment rental industry. Meanwhile, AerCap's steady growth underscores its resilience in the aviation leasing sector. As we look to 2024, United Rentals continues its upward momentum, while AerCap's data remains to be seen, leaving room for speculation and anticipation.
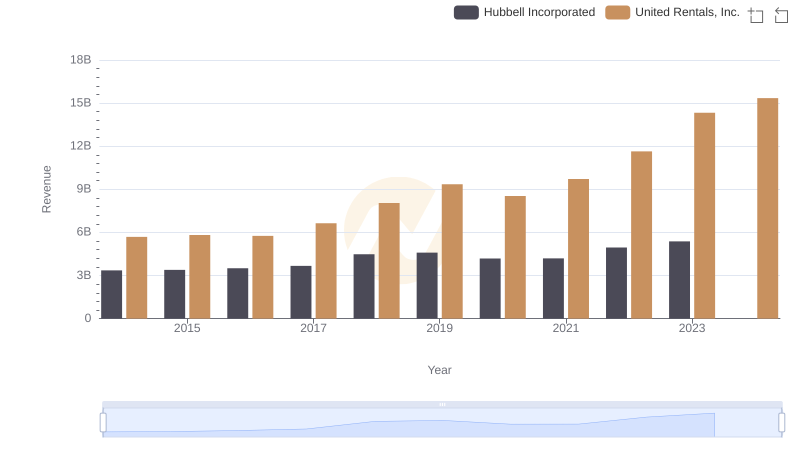
Revenue Showdown: United Rentals, Inc. vs Hubbell Incorporated
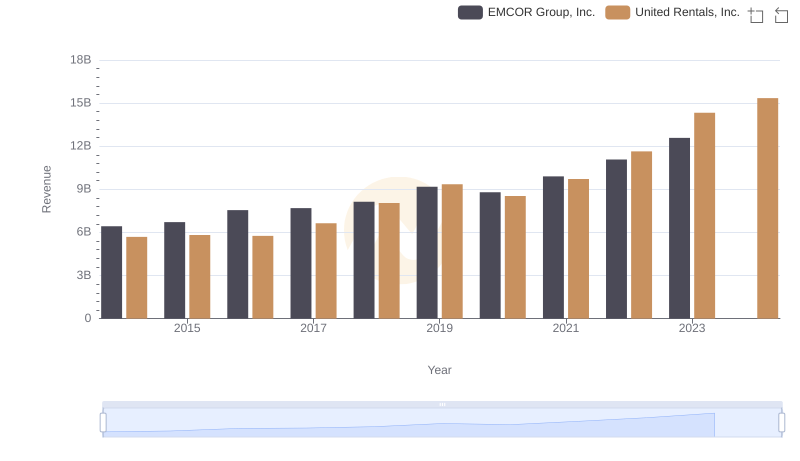
United Rentals, Inc. vs EMCOR Group, Inc.: Examining Key Revenue Metrics
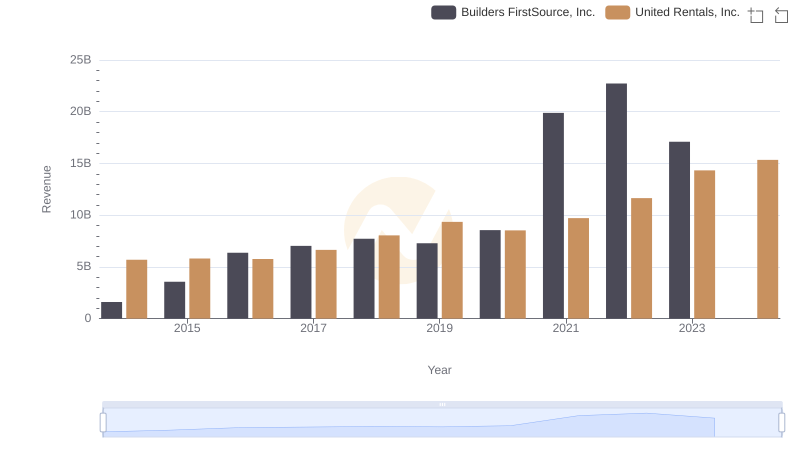
United Rentals, Inc. or Builders FirstSource, Inc.: Who Leads in Yearly Revenue?
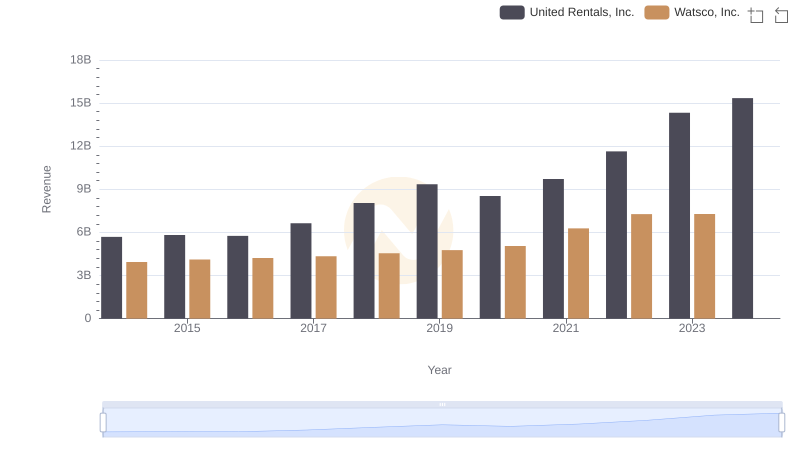
United Rentals, Inc. or Watsco, Inc.: Who Leads in Yearly Revenue?
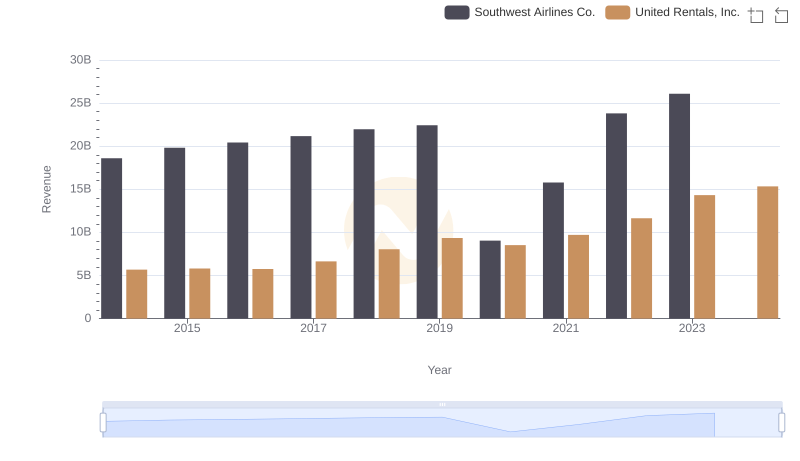
Comparing Revenue Performance: United Rentals, Inc. or Southwest Airlines Co.?
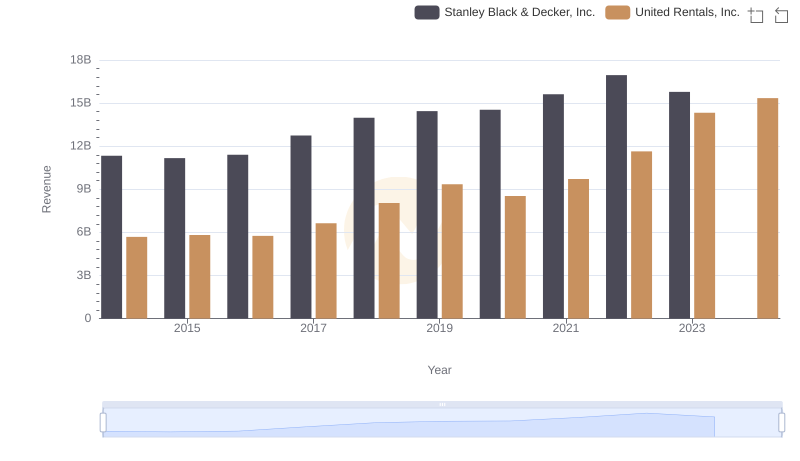
Comparing Revenue Performance: United Rentals, Inc. or Stanley Black & Decker, Inc.?
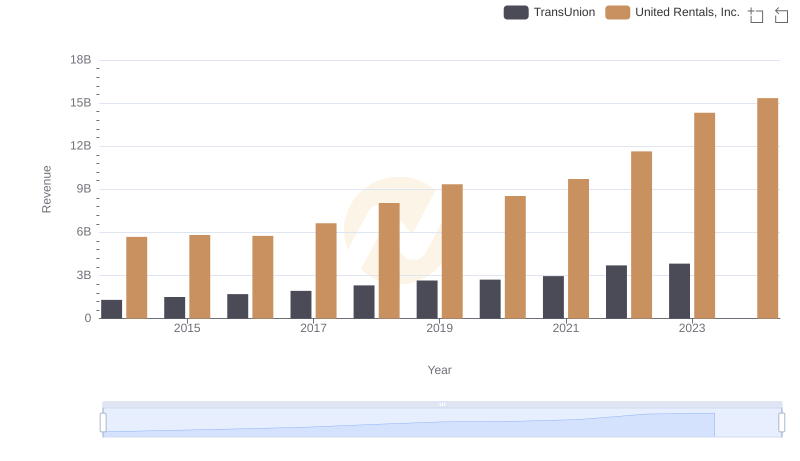
Comparing Revenue Performance: United Rentals, Inc. or TransUnion?

Breaking Down Revenue Trends: United Rentals, Inc. vs Snap-on Incorporated
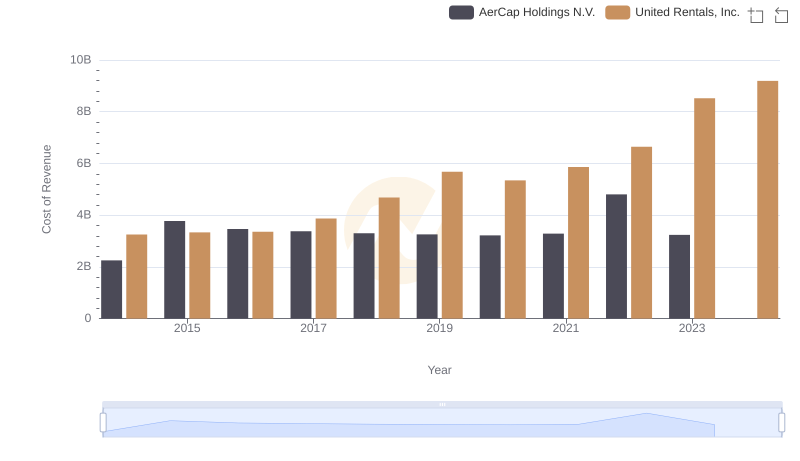
Cost Insights: Breaking Down United Rentals, Inc. and AerCap Holdings N.V.'s Expenses
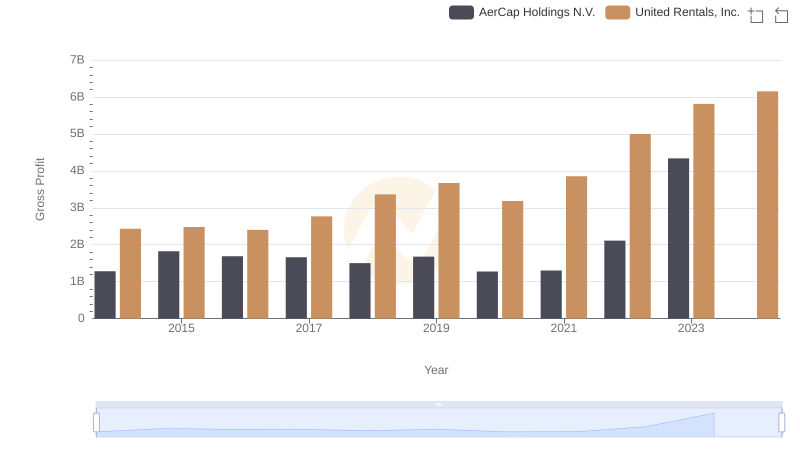
Gross Profit Analysis: Comparing United Rentals, Inc. and AerCap Holdings N.V.
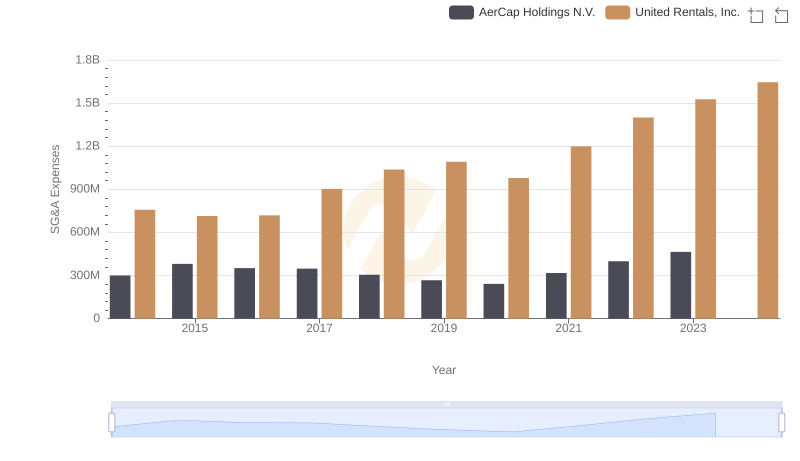
Cost Management Insights: SG&A Expenses for United Rentals, Inc. and AerCap Holdings N.V.
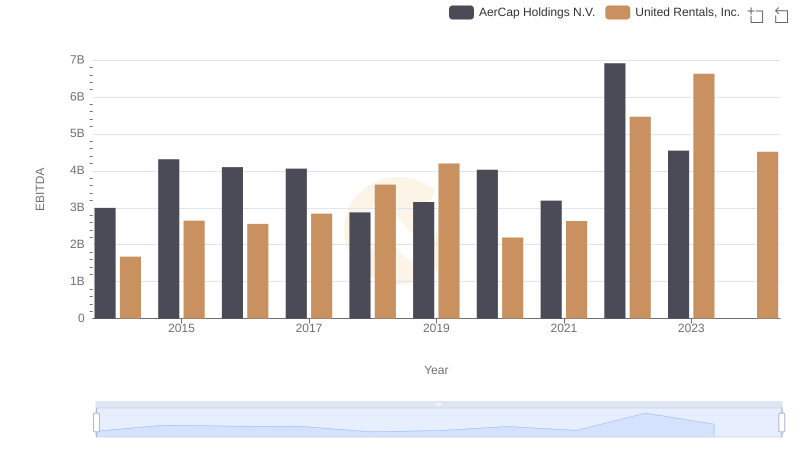
Comparative EBITDA Analysis: United Rentals, Inc. vs AerCap Holdings N.V.