| __timestamp | Lennox International Inc. | Owens Corning |
|---|---|---|
| Wednesday, January 1, 2014 | 2464100000 | 4300000000 |
| Thursday, January 1, 2015 | 2520000000 | 4197000000 |
| Friday, January 1, 2016 | 2565100000 | 4296000000 |
| Sunday, January 1, 2017 | 2714400000 | 4812000000 |
| Monday, January 1, 2018 | 2772700000 | 5425000000 |
| Tuesday, January 1, 2019 | 2727400000 | 5551000000 |
| Wednesday, January 1, 2020 | 2594000000 | 5445000000 |
| Friday, January 1, 2021 | 3005700000 | 6281000000 |
| Saturday, January 1, 2022 | 3433700000 | 7145000000 |
| Sunday, January 1, 2023 | 3434100000 | 6994000000 |
| Monday, January 1, 2024 | 3569400000 |
Data in motion
Over the past decade, Lennox International Inc. and Owens Corning have showcased intriguing financial trajectories in their cost of revenue. Lennox International Inc. has seen a steady increase, with costs rising approximately 45% from 2014 to 2024. This growth reflects their strategic investments and market expansion. In contrast, Owens Corning's cost of revenue surged by nearly 67% from 2014 to 2022, peaking in 2022 before a slight dip in 2023. This fluctuation highlights their adaptive strategies in a competitive market.
Lennox's consistent growth, even during economic downturns, underscores their robust business model. Meanwhile, Owens Corning's peak in 2022, followed by a decline, suggests a recalibration in their operational strategies. Notably, data for 2024 is missing for Owens Corning, indicating potential shifts or reporting delays. These insights offer a window into the evolving landscape of these industry giants.
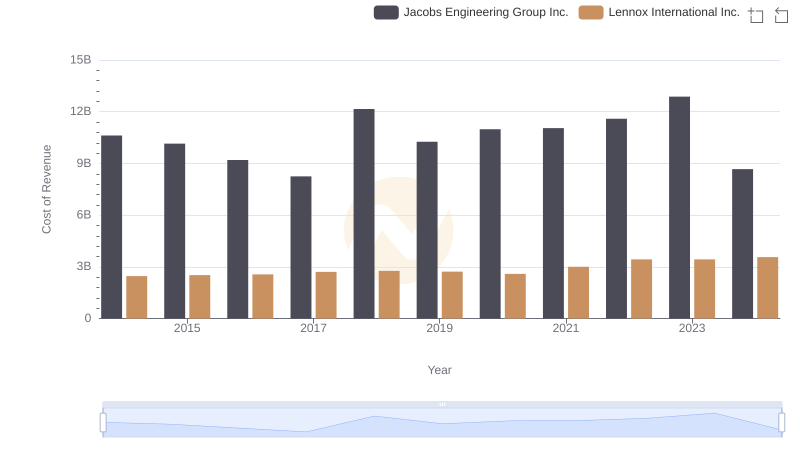
Cost of Revenue Trends: Lennox International Inc. vs Jacobs Engineering Group Inc.
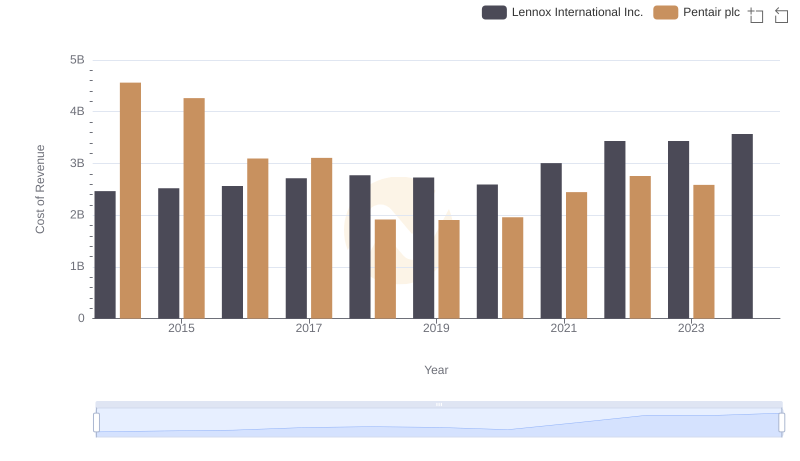
Cost Insights: Breaking Down Lennox International Inc. and Pentair plc's Expenses
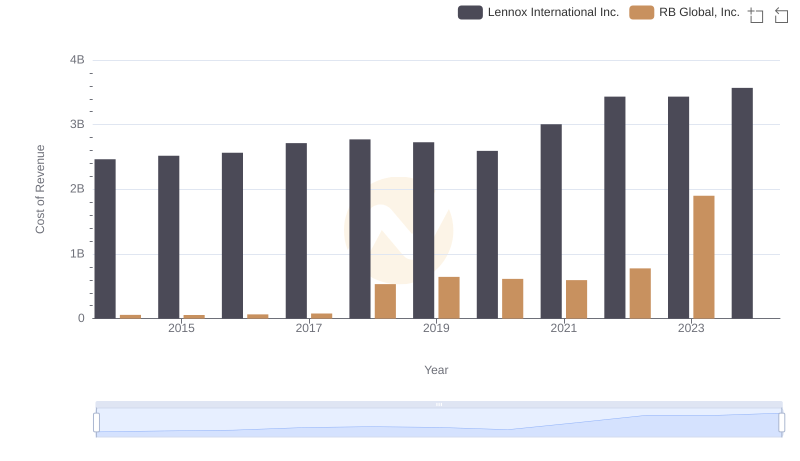
Cost of Revenue Comparison: Lennox International Inc. vs RB Global, Inc.
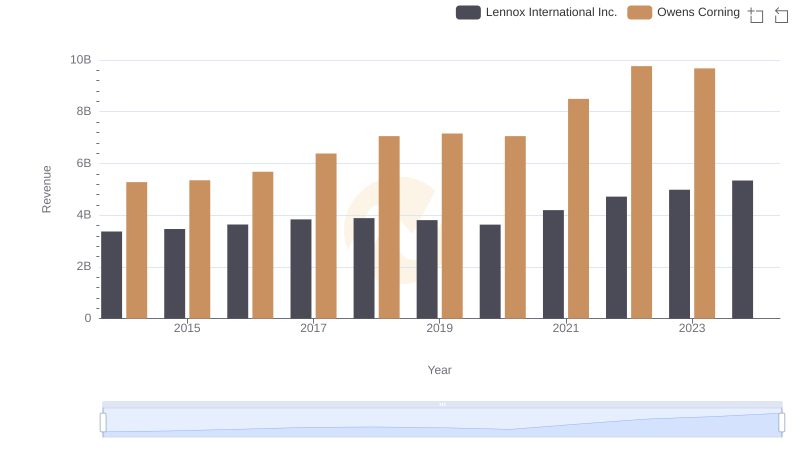
Lennox International Inc. and Owens Corning: A Comprehensive Revenue Analysis
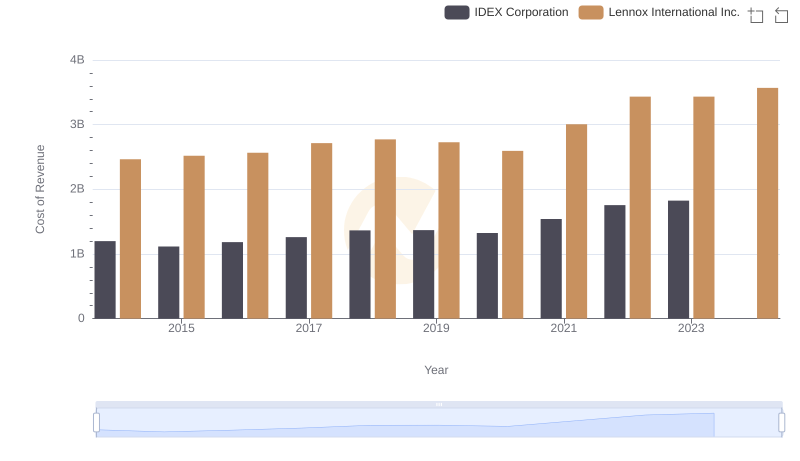
Cost of Revenue Trends: Lennox International Inc. vs IDEX Corporation
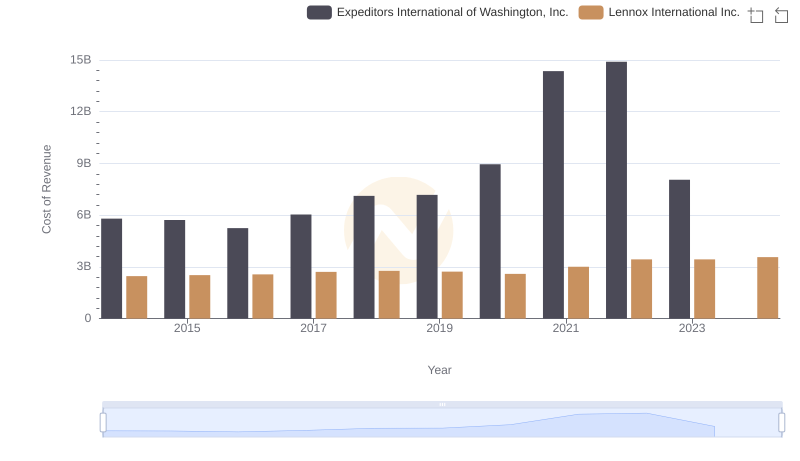
Cost Insights: Breaking Down Lennox International Inc. and Expeditors International of Washington, Inc.'s Expenses
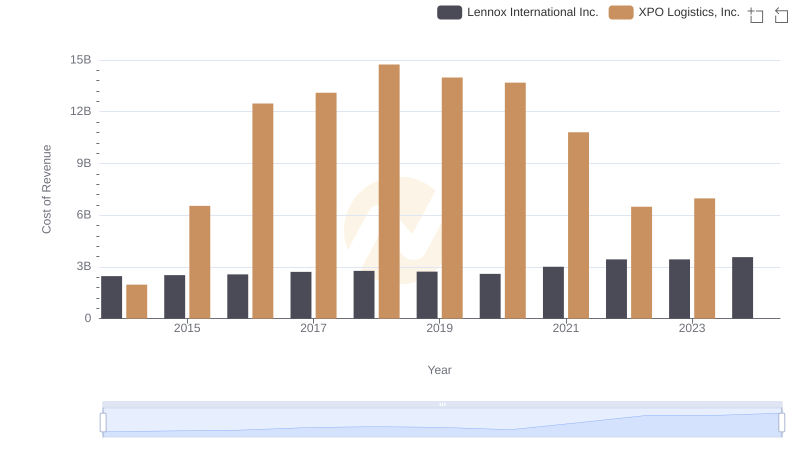
Lennox International Inc. vs XPO Logistics, Inc.: Efficiency in Cost of Revenue Explored
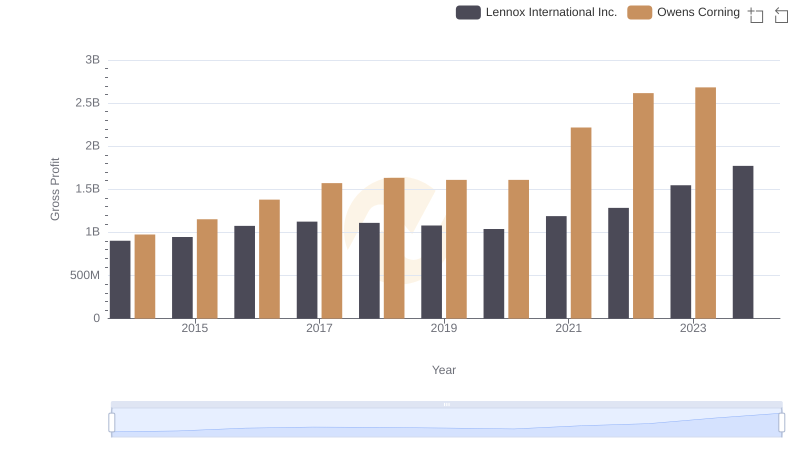
Gross Profit Analysis: Comparing Lennox International Inc. and Owens Corning
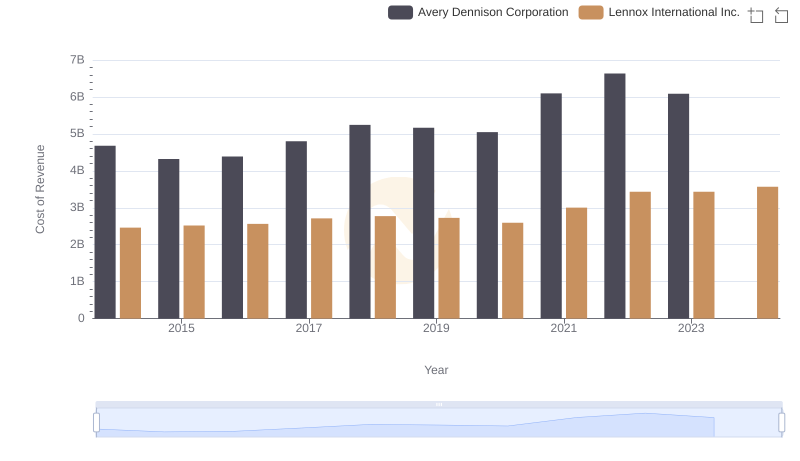
Cost of Revenue Comparison: Lennox International Inc. vs Avery Dennison Corporation
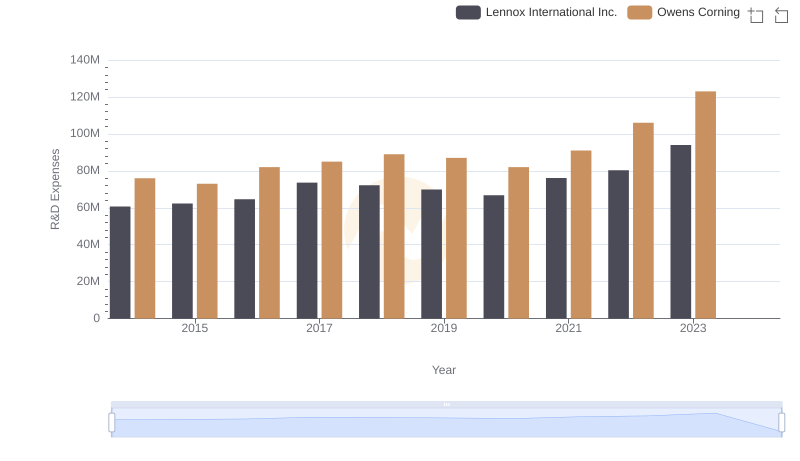
Research and Development: Comparing Key Metrics for Lennox International Inc. and Owens Corning
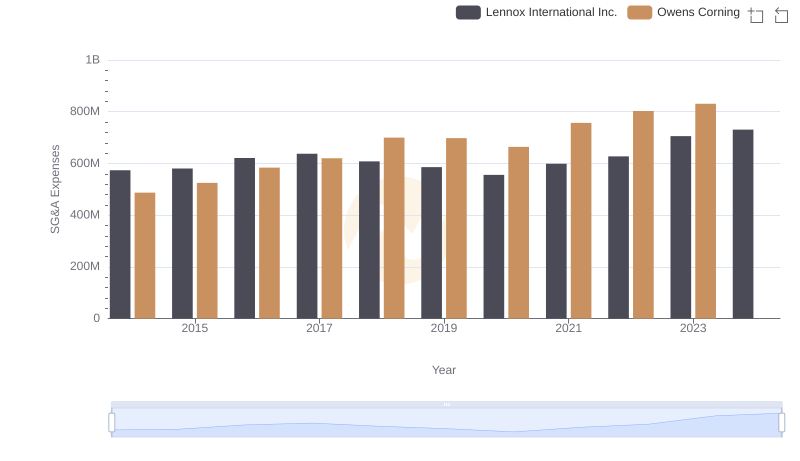
Lennox International Inc. or Owens Corning: Who Manages SG&A Costs Better?
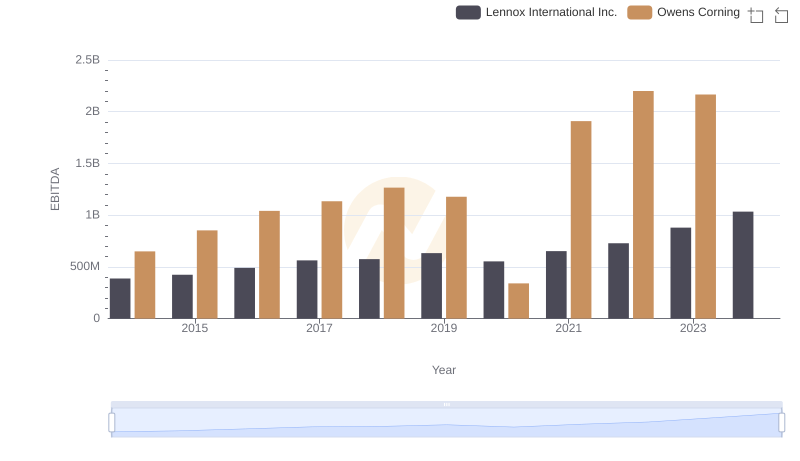
Comparative EBITDA Analysis: Lennox International Inc. vs Owens Corning