| __timestamp | Lennox International Inc. | RB Global, Inc. |
|---|---|---|
| Wednesday, January 1, 2014 | 2464100000 | 57884000 |
| Thursday, January 1, 2015 | 2520000000 | 56026000 |
| Friday, January 1, 2016 | 2565100000 | 66062000 |
| Sunday, January 1, 2017 | 2714400000 | 79013000 |
| Monday, January 1, 2018 | 2772700000 | 533397000 |
| Tuesday, January 1, 2019 | 2727400000 | 645816000 |
| Wednesday, January 1, 2020 | 2594000000 | 615589000 |
| Friday, January 1, 2021 | 3005700000 | 594783000 |
| Saturday, January 1, 2022 | 3433700000 | 776701000 |
| Sunday, January 1, 2023 | 3434100000 | 1901200000 |
| Monday, January 1, 2024 | 3569400000 | 0 |
Unlocking the unknown
In the ever-evolving landscape of the industrial sector, Lennox International Inc. and RB Global, Inc. have showcased intriguing trends in their cost of revenue over the past decade. From 2014 to 2023, Lennox International Inc. consistently demonstrated a robust growth trajectory, with its cost of revenue increasing by approximately 45%, peaking at $3.57 billion in 2023. This reflects the company's strategic investments and operational efficiencies.
Conversely, RB Global, Inc. experienced a more volatile journey. Starting with a modest cost of revenue in 2014, the company saw a dramatic surge, particularly in 2023, where it reached $1.9 billion, marking a significant increase from previous years. However, data for 2024 remains elusive, leaving room for speculation on future trends.
These insights offer a compelling glimpse into the financial dynamics of these industry giants, highlighting the diverse strategies employed to navigate market challenges.
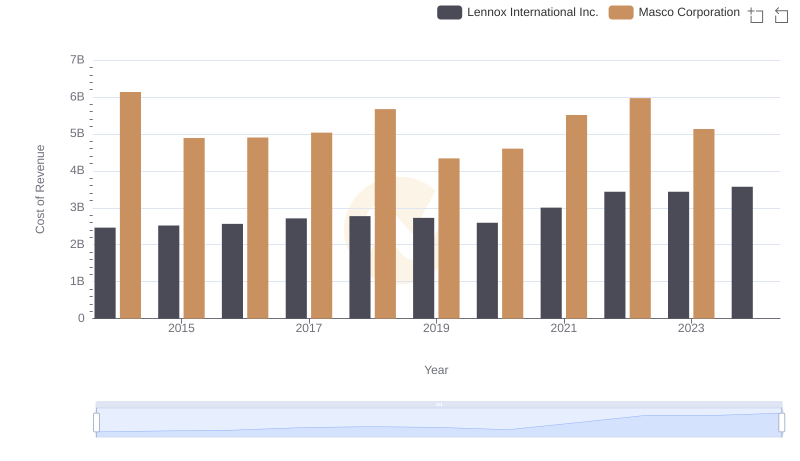
Analyzing Cost of Revenue: Lennox International Inc. and Masco Corporation
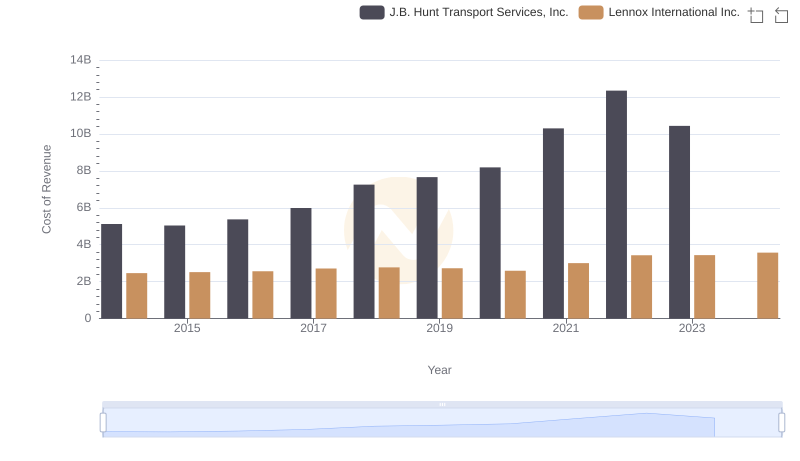
Comparing Cost of Revenue Efficiency: Lennox International Inc. vs J.B. Hunt Transport Services, Inc.
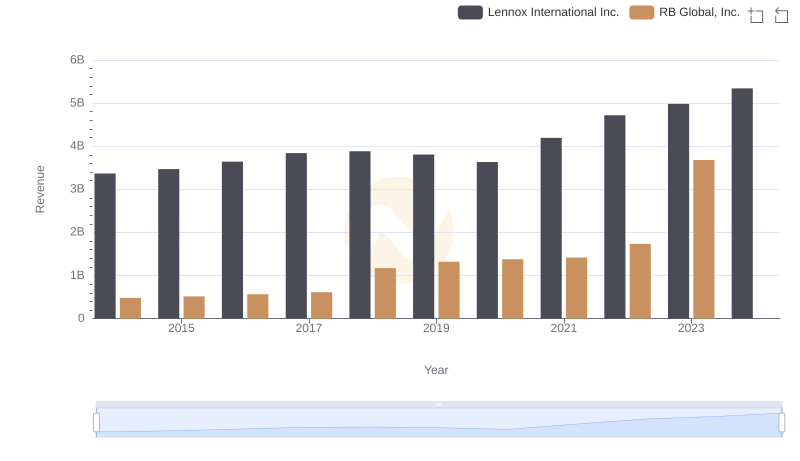
Comparing Revenue Performance: Lennox International Inc. or RB Global, Inc.?
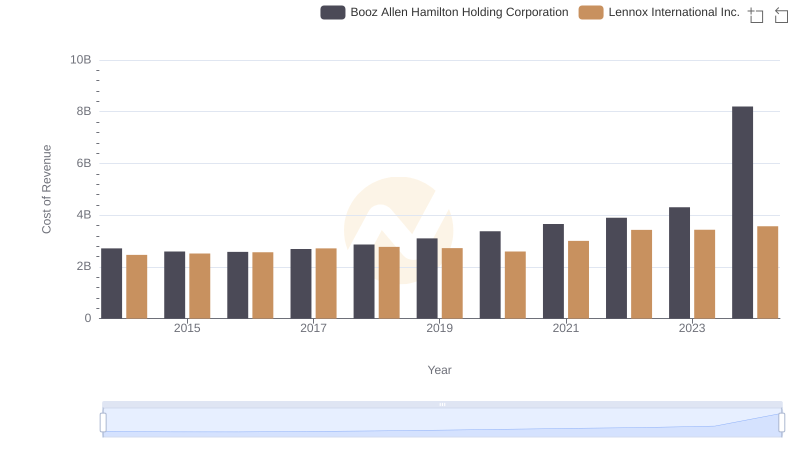
Analyzing Cost of Revenue: Lennox International Inc. and Booz Allen Hamilton Holding Corporation
Comparing Cost of Revenue Efficiency: Lennox International Inc. vs Carlisle Companies Incorporated
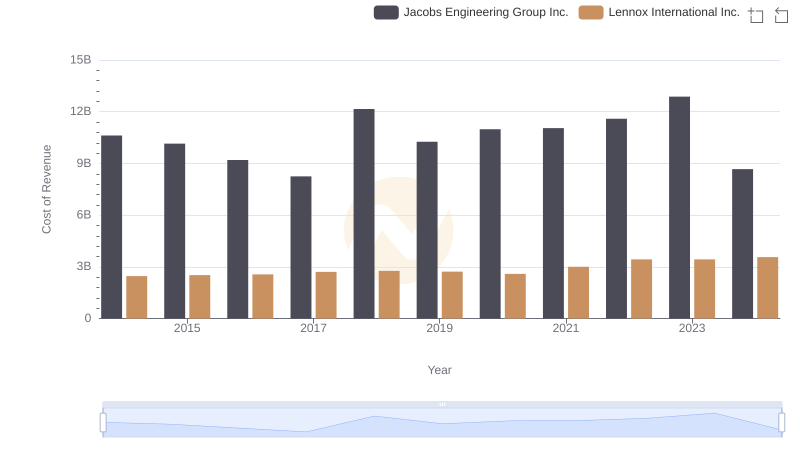
Cost of Revenue Trends: Lennox International Inc. vs Jacobs Engineering Group Inc.
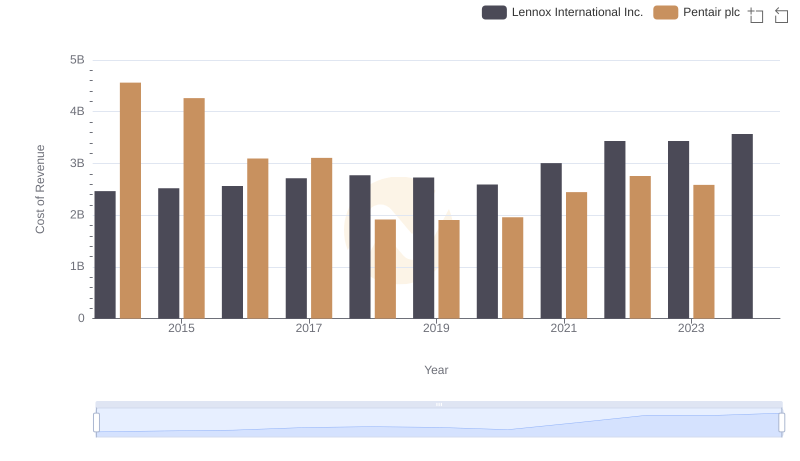
Cost Insights: Breaking Down Lennox International Inc. and Pentair plc's Expenses
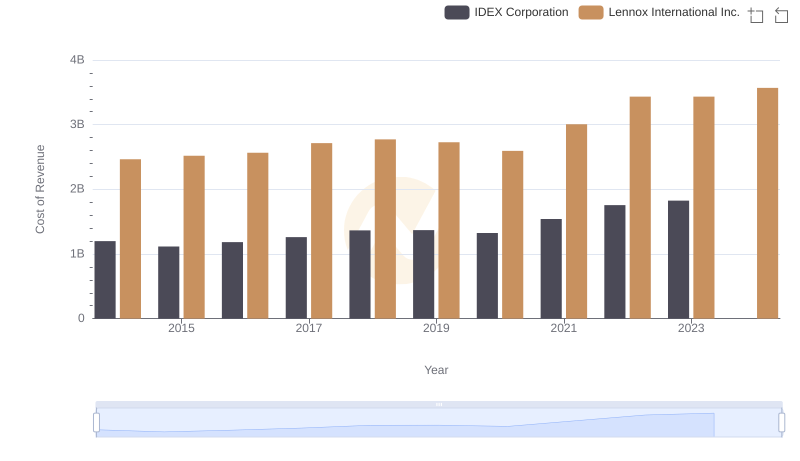
Cost of Revenue Trends: Lennox International Inc. vs IDEX Corporation
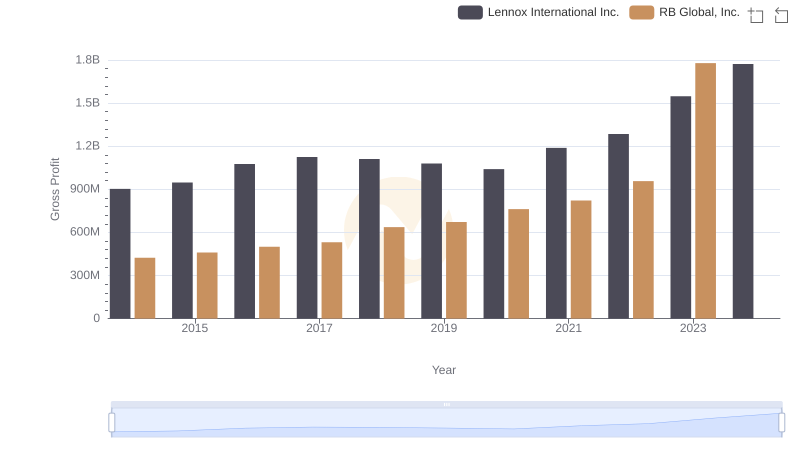
Lennox International Inc. vs RB Global, Inc.: A Gross Profit Performance Breakdown
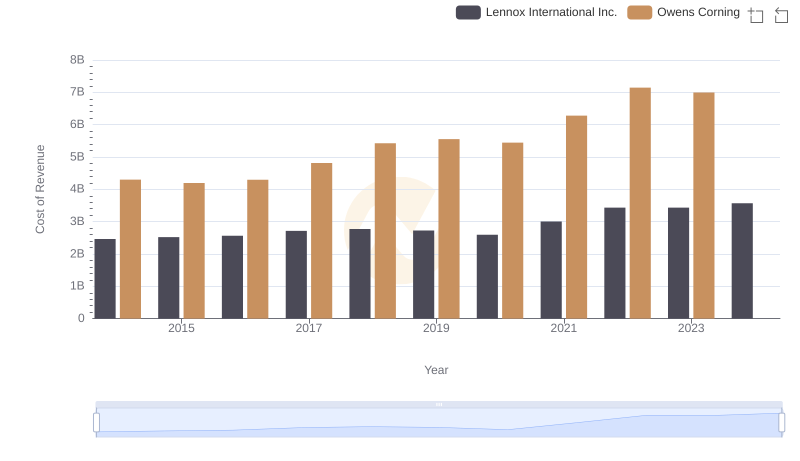
Cost Insights: Breaking Down Lennox International Inc. and Owens Corning's Expenses
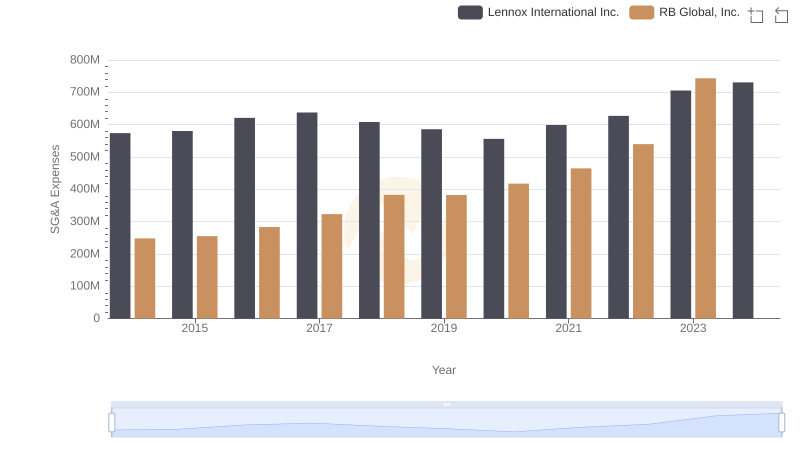
Operational Costs Compared: SG&A Analysis of Lennox International Inc. and RB Global, Inc.
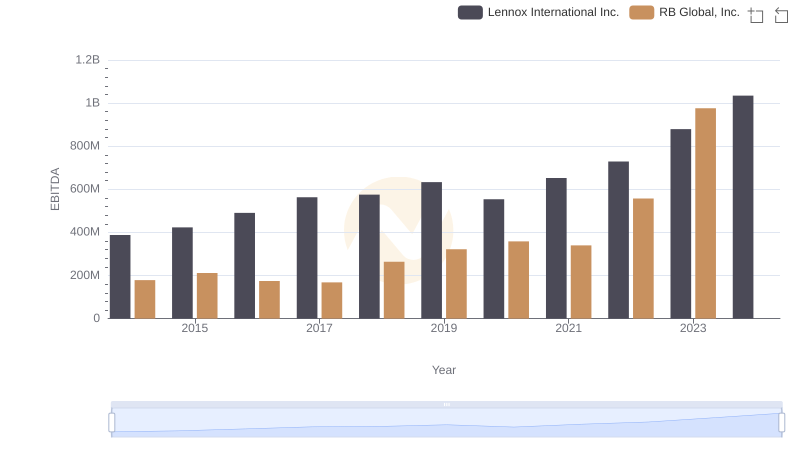
Lennox International Inc. and RB Global, Inc.: A Detailed Examination of EBITDA Performance