| __timestamp | Avery Dennison Corporation | Lennox International Inc. |
|---|---|---|
| Wednesday, January 1, 2014 | 4679100000 | 2464100000 |
| Thursday, January 1, 2015 | 4321100000 | 2520000000 |
| Friday, January 1, 2016 | 4386800000 | 2565100000 |
| Sunday, January 1, 2017 | 4801600000 | 2714400000 |
| Monday, January 1, 2018 | 5243500000 | 2772700000 |
| Tuesday, January 1, 2019 | 5166000000 | 2727400000 |
| Wednesday, January 1, 2020 | 5048200000 | 2594000000 |
| Friday, January 1, 2021 | 6095500000 | 3005700000 |
| Saturday, January 1, 2022 | 6635100000 | 3433700000 |
| Sunday, January 1, 2023 | 6086800000 | 3434100000 |
| Monday, January 1, 2024 | 6225000000 | 3569400000 |
Unleashing insights
In the competitive landscape of industrial manufacturing, Lennox International Inc. and Avery Dennison Corporation stand as titans. Over the past decade, Avery Dennison has consistently outpaced Lennox in terms of cost of revenue, with a notable 50% higher average. From 2014 to 2023, Avery Dennison's cost of revenue surged by approximately 40%, peaking in 2022. Meanwhile, Lennox International saw a steady increase of about 39% over the same period, reaching its highest in 2024. This trend highlights Avery Dennison's aggressive expansion and market adaptation strategies. However, the data for 2024 shows a gap for Avery Dennison, indicating potential shifts or reporting delays. As these companies navigate the evolving market, their cost management strategies will be crucial in maintaining competitive edges. Stay tuned as we delve deeper into the financial strategies that drive these industry leaders.
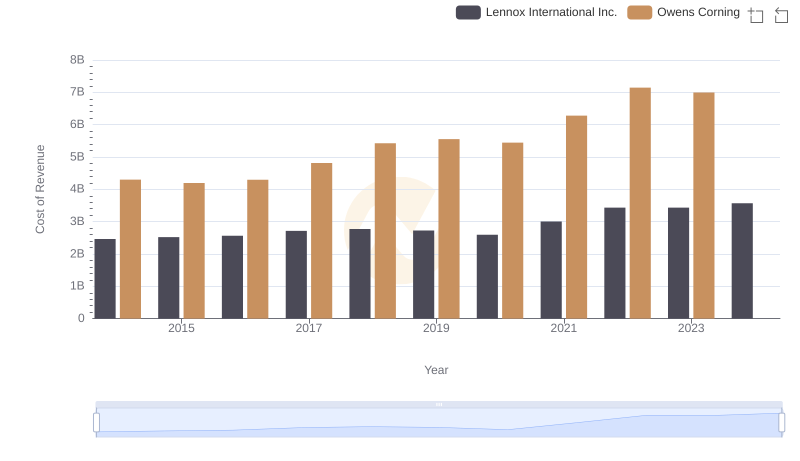
Cost Insights: Breaking Down Lennox International Inc. and Owens Corning's Expenses
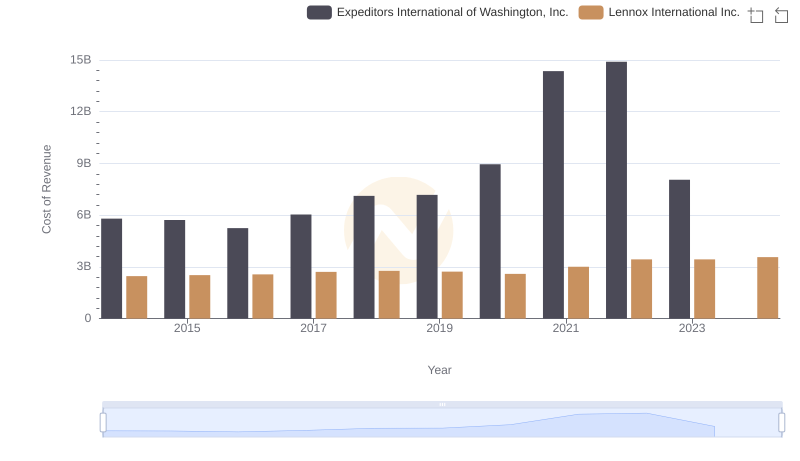
Cost Insights: Breaking Down Lennox International Inc. and Expeditors International of Washington, Inc.'s Expenses
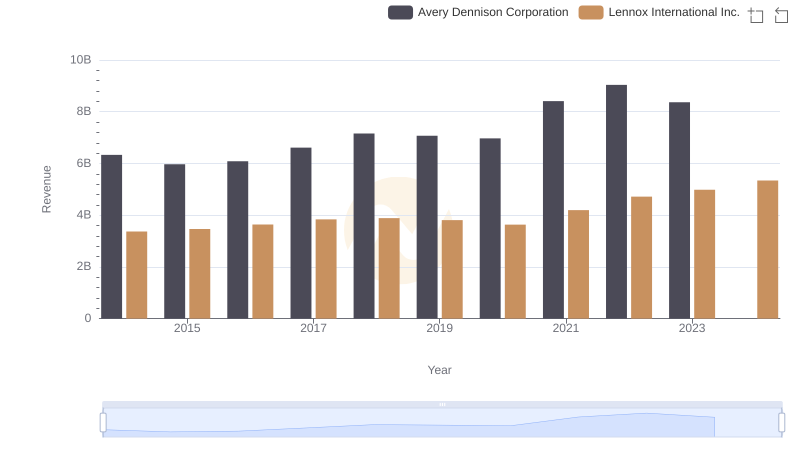
Lennox International Inc. and Avery Dennison Corporation: A Comprehensive Revenue Analysis
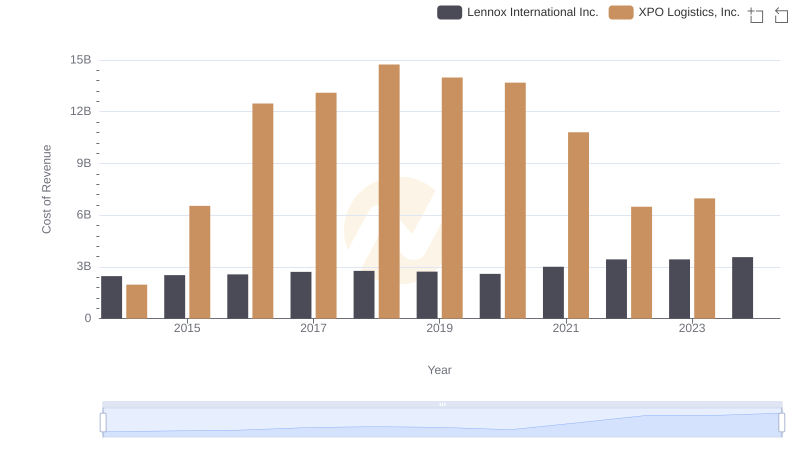
Lennox International Inc. vs XPO Logistics, Inc.: Efficiency in Cost of Revenue Explored
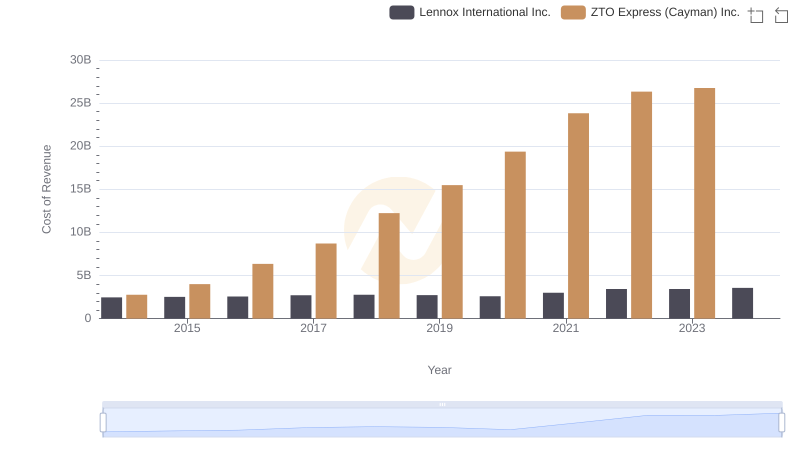
Lennox International Inc. vs ZTO Express (Cayman) Inc.: Efficiency in Cost of Revenue Explored
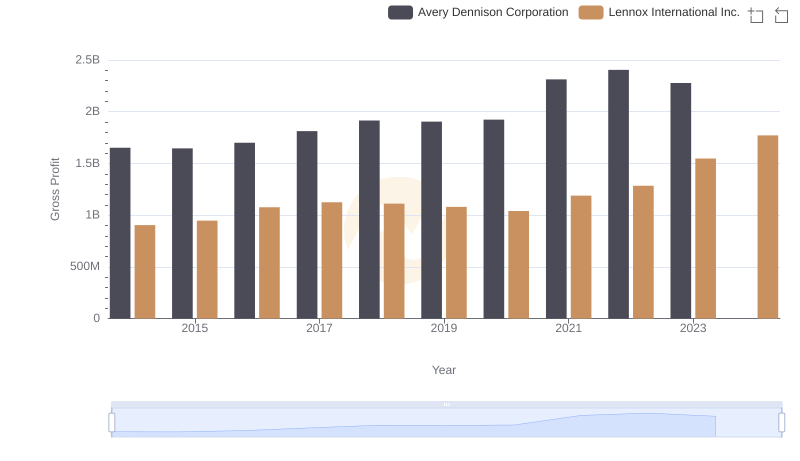
Gross Profit Analysis: Comparing Lennox International Inc. and Avery Dennison Corporation
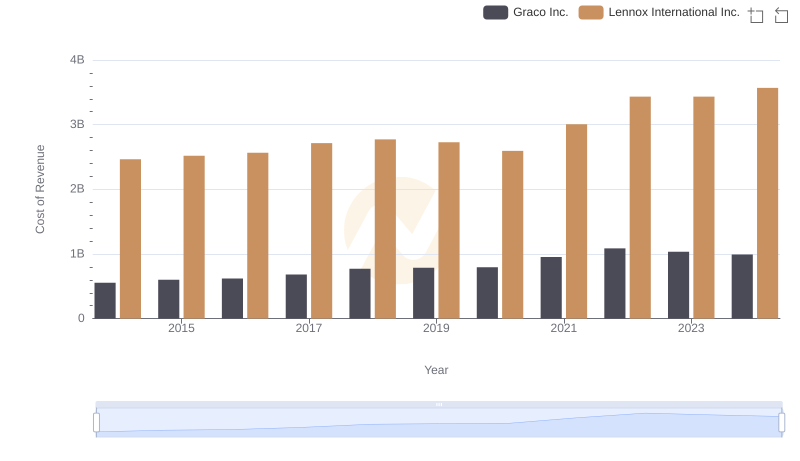
Cost of Revenue Comparison: Lennox International Inc. vs Graco Inc.
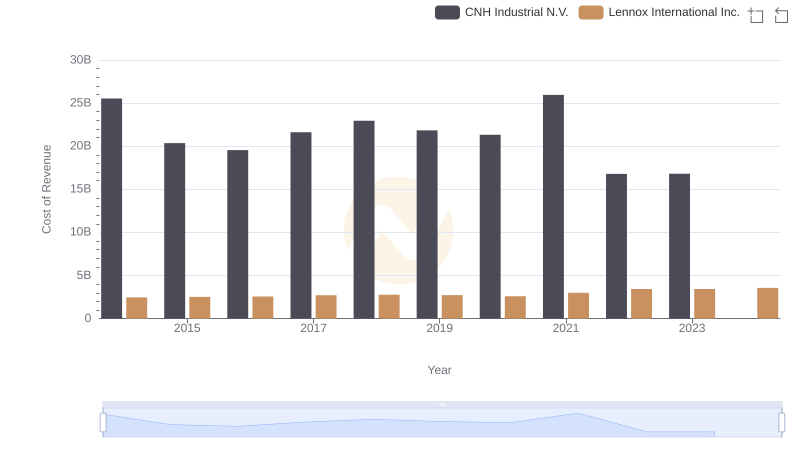
Cost of Revenue Trends: Lennox International Inc. vs CNH Industrial N.V.
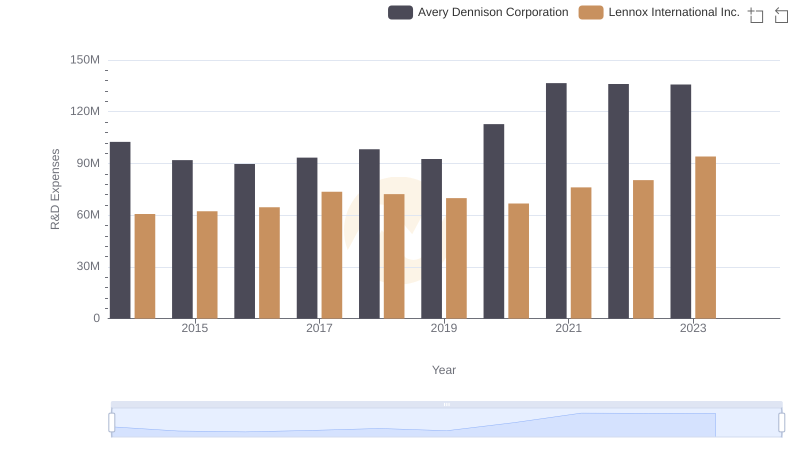
Lennox International Inc. or Avery Dennison Corporation: Who Invests More in Innovation?
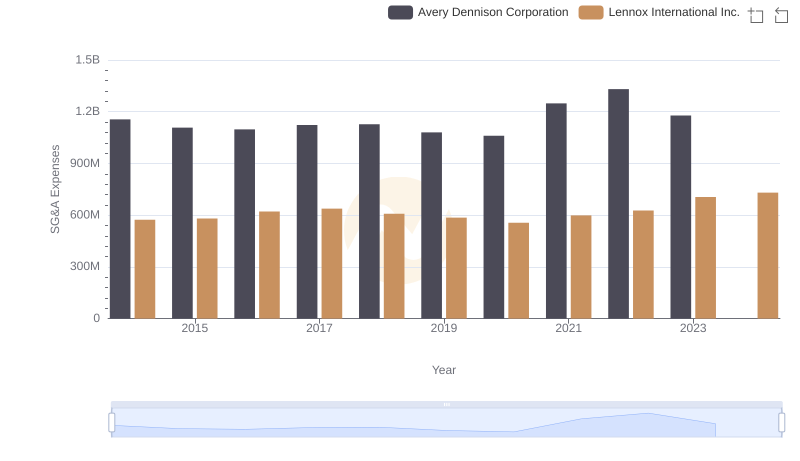
Operational Costs Compared: SG&A Analysis of Lennox International Inc. and Avery Dennison Corporation
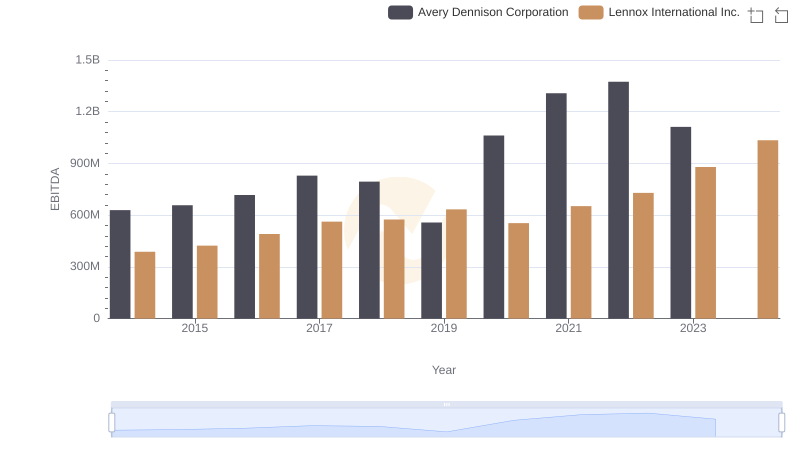
A Professional Review of EBITDA: Lennox International Inc. Compared to Avery Dennison Corporation