| __timestamp | Expeditors International of Washington, Inc. | Lennox International Inc. |
|---|---|---|
| Wednesday, January 1, 2014 | 5800725000 | 2464100000 |
| Thursday, January 1, 2015 | 5720848000 | 2520000000 |
| Friday, January 1, 2016 | 5247244000 | 2565100000 |
| Sunday, January 1, 2017 | 6037921000 | 2714400000 |
| Monday, January 1, 2018 | 7118083000 | 2772700000 |
| Tuesday, January 1, 2019 | 7178405000 | 2727400000 |
| Wednesday, January 1, 2020 | 8953716000 | 2594000000 |
| Friday, January 1, 2021 | 14358105000 | 3005700000 |
| Saturday, January 1, 2022 | 14900154000 | 3433700000 |
| Sunday, January 1, 2023 | 8054634000 | 3434100000 |
| Monday, January 1, 2024 | 0 | 3569400000 |
Cracking the code
In the ever-evolving landscape of corporate finance, understanding cost structures is pivotal. This analysis delves into the cost of revenue trends for Lennox International Inc. and Expeditors International of Washington, Inc. from 2014 to 2023. Over this decade, Expeditors International saw a remarkable 175% increase in its cost of revenue, peaking in 2022. However, 2023 marked a significant drop, indicating potential shifts in operational strategies or market conditions. In contrast, Lennox International exhibited a steady growth pattern, with a 39% rise over the same period, reflecting consistent operational efficiency. Notably, 2024 data for Expeditors is missing, suggesting a need for further investigation. This comparative insight not only highlights the dynamic nature of these industries but also underscores the importance of strategic cost management in maintaining competitive advantage.
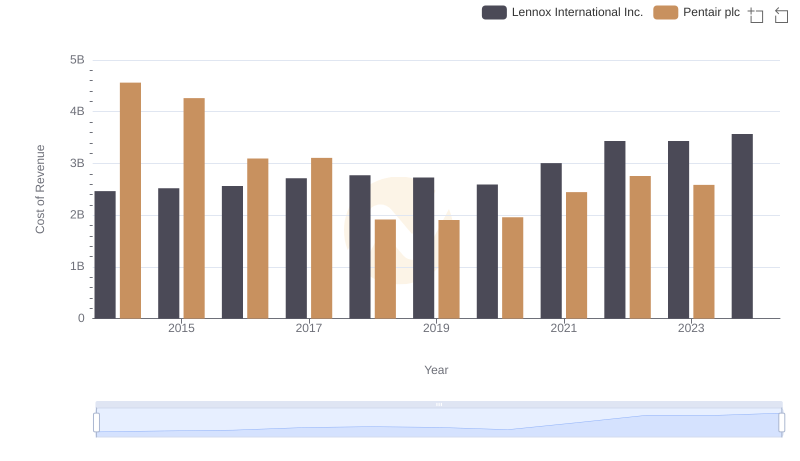
Cost Insights: Breaking Down Lennox International Inc. and Pentair plc's Expenses
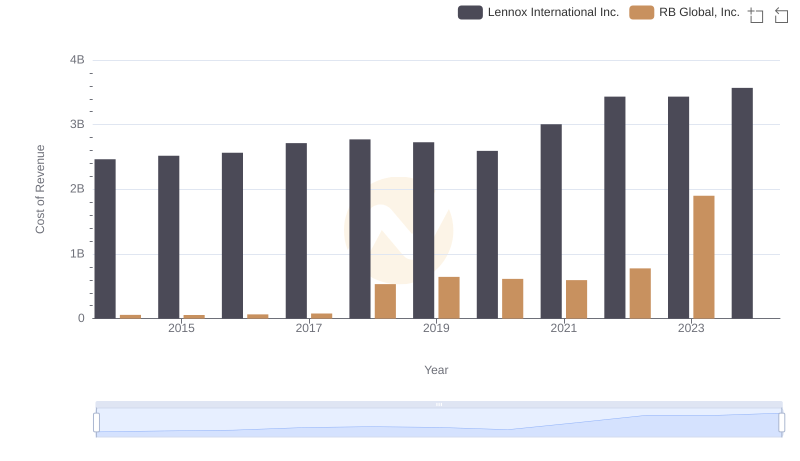
Cost of Revenue Comparison: Lennox International Inc. vs RB Global, Inc.
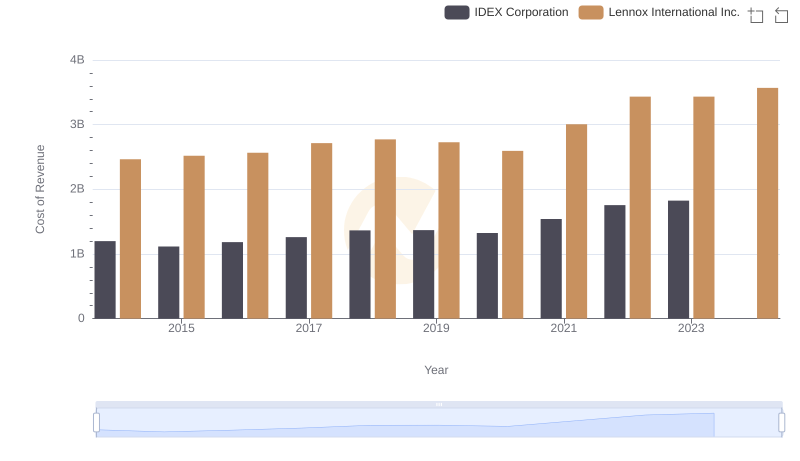
Cost of Revenue Trends: Lennox International Inc. vs IDEX Corporation
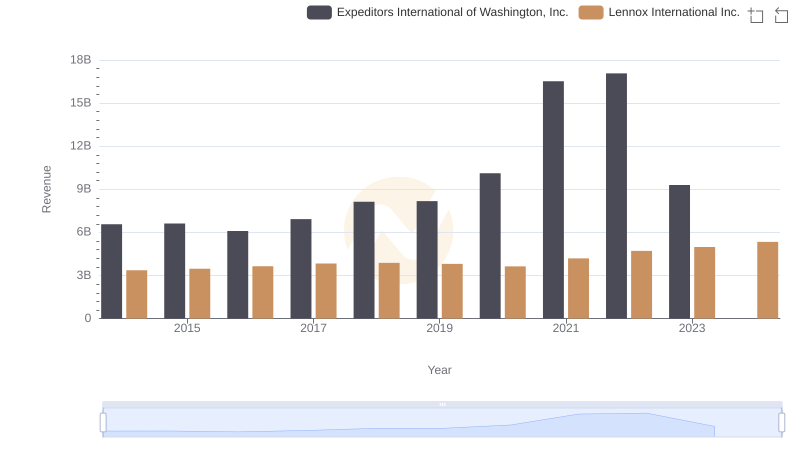
Lennox International Inc. vs Expeditors International of Washington, Inc.: Examining Key Revenue Metrics
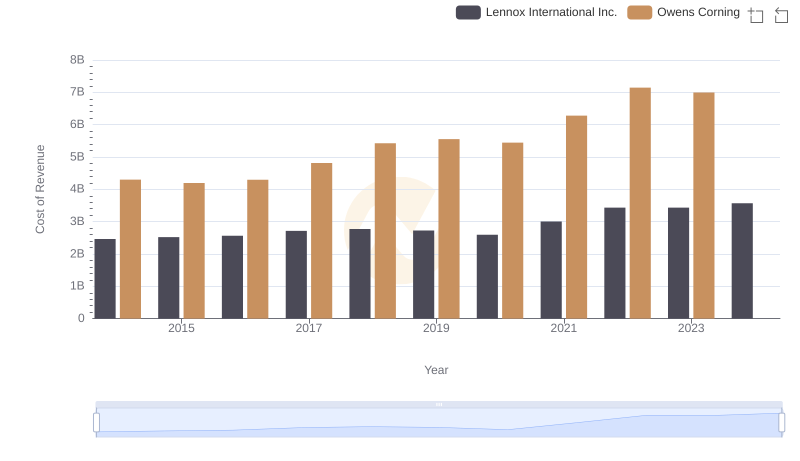
Cost Insights: Breaking Down Lennox International Inc. and Owens Corning's Expenses
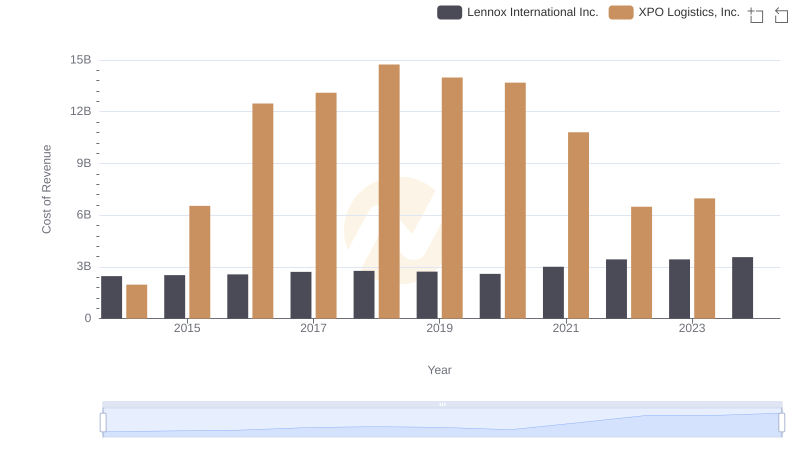
Lennox International Inc. vs XPO Logistics, Inc.: Efficiency in Cost of Revenue Explored
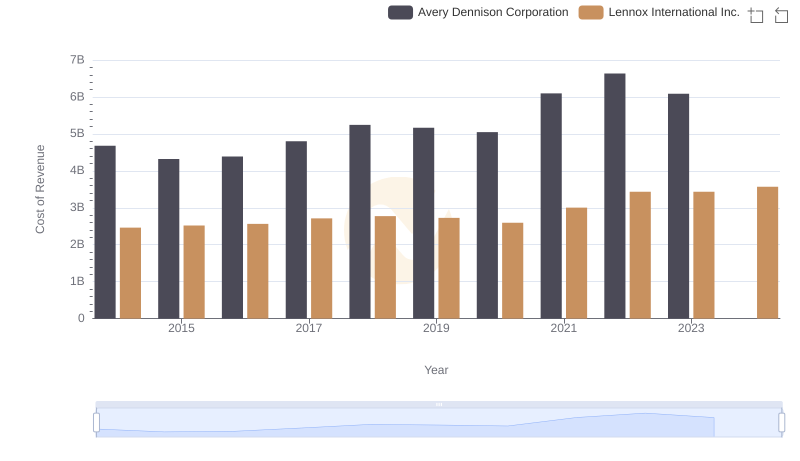
Cost of Revenue Comparison: Lennox International Inc. vs Avery Dennison Corporation
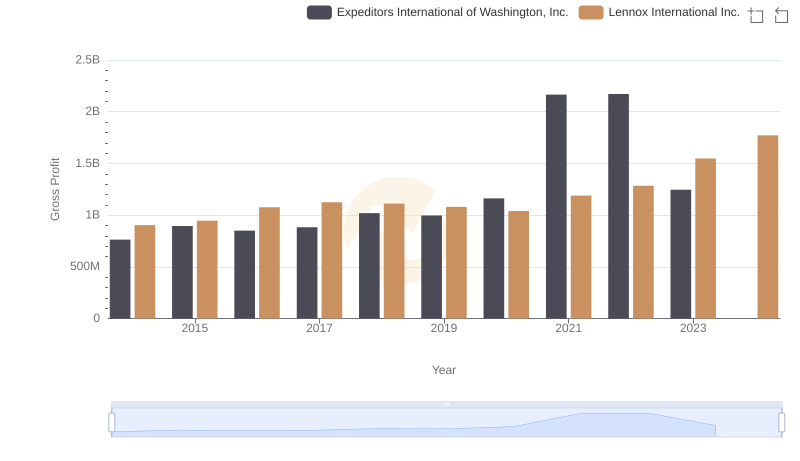
Gross Profit Trends Compared: Lennox International Inc. vs Expeditors International of Washington, Inc.
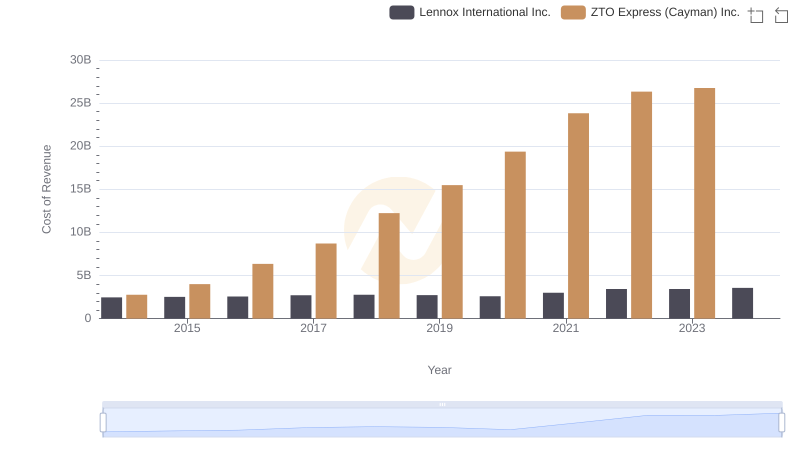
Lennox International Inc. vs ZTO Express (Cayman) Inc.: Efficiency in Cost of Revenue Explored
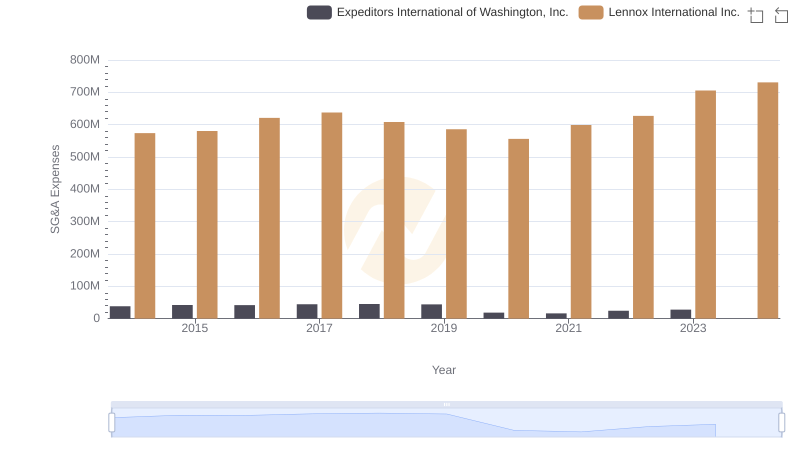
SG&A Efficiency Analysis: Comparing Lennox International Inc. and Expeditors International of Washington, Inc.
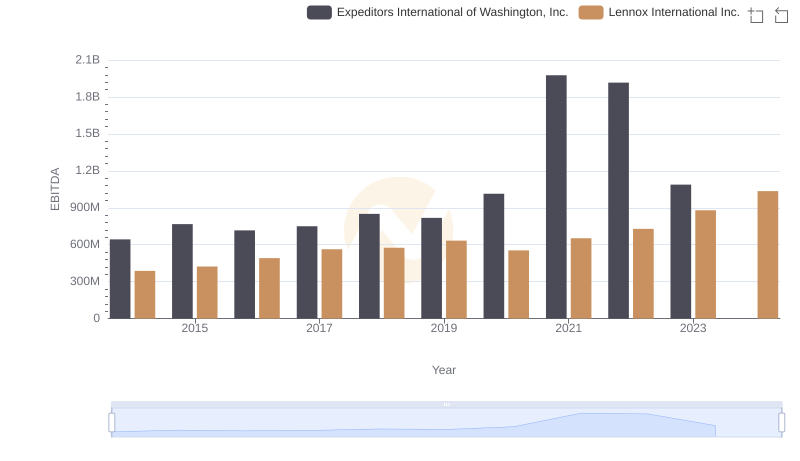
Lennox International Inc. and Expeditors International of Washington, Inc.: A Detailed Examination of EBITDA Performance