| __timestamp | Jacobs Engineering Group Inc. | Lennox International Inc. |
|---|---|---|
| Wednesday, January 1, 2014 | 10621373000 | 2464100000 |
| Thursday, January 1, 2015 | 10146494000 | 2520000000 |
| Friday, January 1, 2016 | 9196326000 | 2565100000 |
| Sunday, January 1, 2017 | 8250536000 | 2714400000 |
| Monday, January 1, 2018 | 12156276000 | 2772700000 |
| Tuesday, January 1, 2019 | 10260840000 | 2727400000 |
| Wednesday, January 1, 2020 | 10980307000 | 2594000000 |
| Friday, January 1, 2021 | 11048860000 | 3005700000 |
| Saturday, January 1, 2022 | 11595785000 | 3433700000 |
| Sunday, January 1, 2023 | 12879099000 | 3434100000 |
| Monday, January 1, 2024 | 8668185000 | 3569400000 |
Unleashing insights
In the ever-evolving landscape of industrial giants, Lennox International Inc. and Jacobs Engineering Group Inc. have showcased intriguing cost of revenue trends over the past decade. From 2014 to 2023, Jacobs Engineering Group Inc. experienced a notable fluctuation, with a peak in 2023, where costs surged by approximately 25% compared to 2014. Meanwhile, Lennox International Inc. demonstrated a steady upward trajectory, with costs increasing by nearly 45% over the same period.
Jacobs Engineering's cost of revenue saw a significant dip in 2017, reaching its lowest point, while Lennox maintained a more consistent growth pattern. This divergence highlights differing strategic approaches and market conditions faced by these companies. As we look to 2024, Lennox's costs continue to rise, while Jacobs shows a marked decrease, suggesting potential shifts in operational strategies or market dynamics.
These trends offer a window into the financial health and strategic priorities of these industry leaders, providing valuable insights for investors and analysts alike.
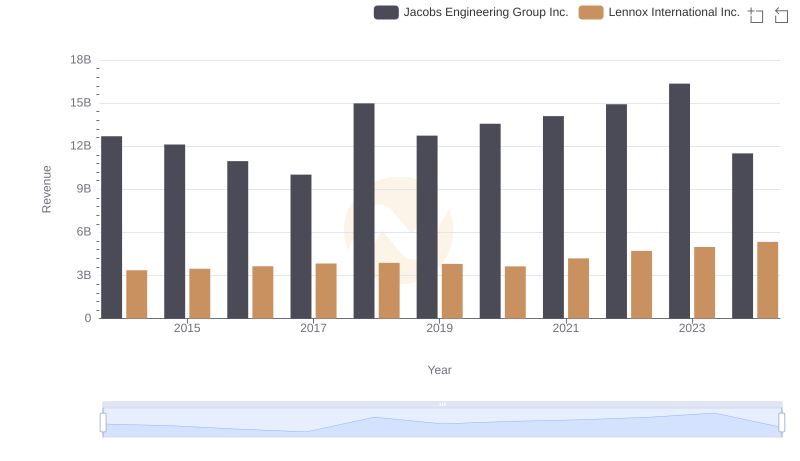
Revenue Showdown: Lennox International Inc. vs Jacobs Engineering Group Inc.
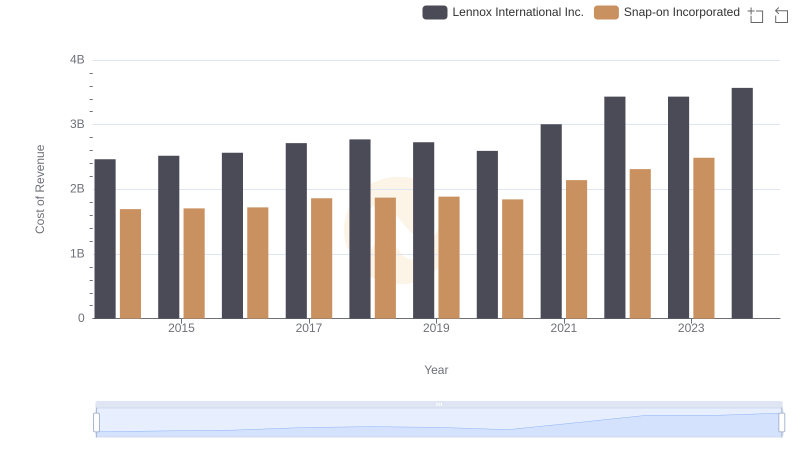
Cost Insights: Breaking Down Lennox International Inc. and Snap-on Incorporated's Expenses
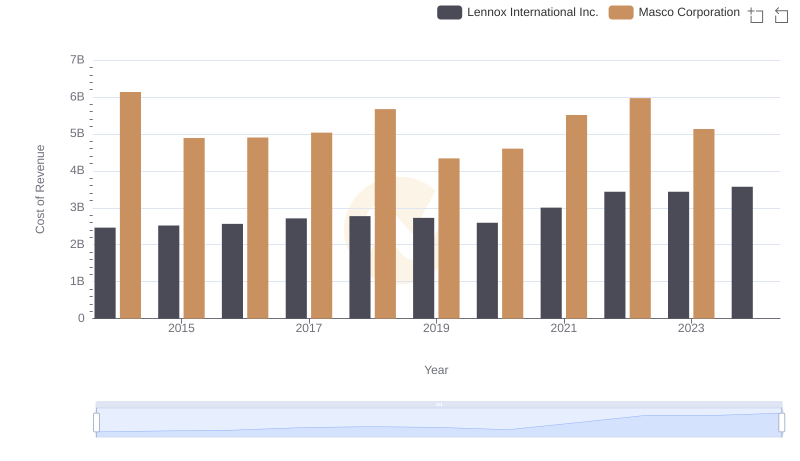
Analyzing Cost of Revenue: Lennox International Inc. and Masco Corporation
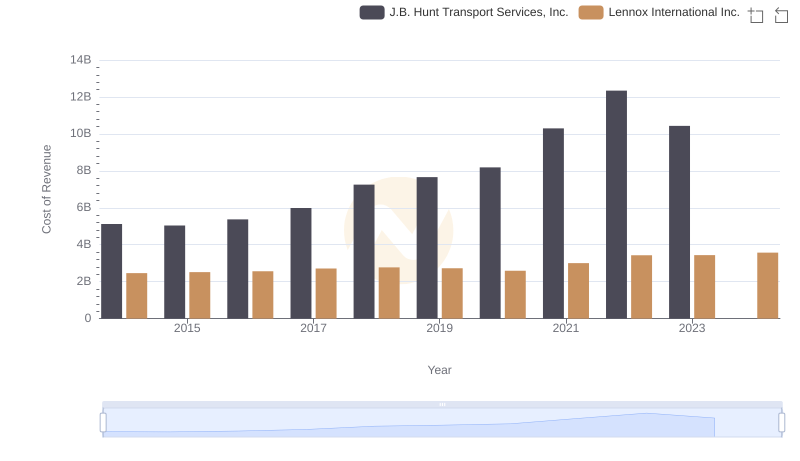
Comparing Cost of Revenue Efficiency: Lennox International Inc. vs J.B. Hunt Transport Services, Inc.
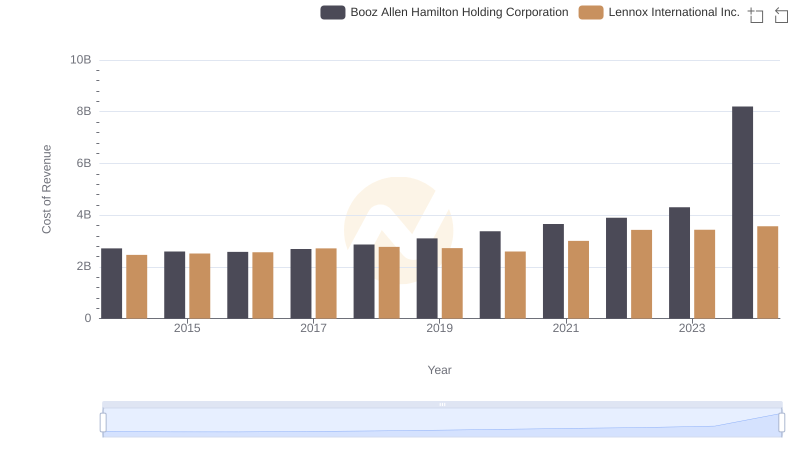
Analyzing Cost of Revenue: Lennox International Inc. and Booz Allen Hamilton Holding Corporation
Comparing Cost of Revenue Efficiency: Lennox International Inc. vs Carlisle Companies Incorporated
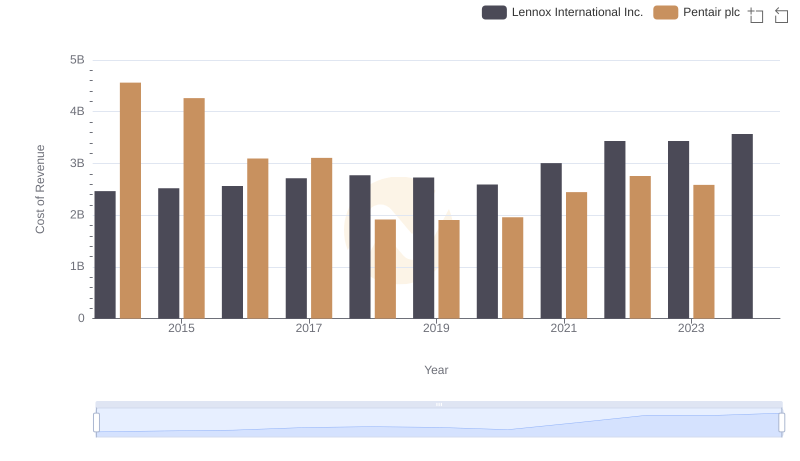
Cost Insights: Breaking Down Lennox International Inc. and Pentair plc's Expenses
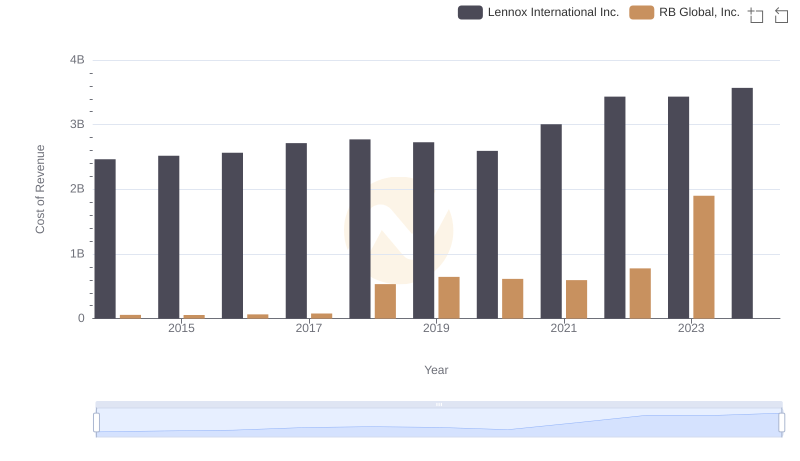
Cost of Revenue Comparison: Lennox International Inc. vs RB Global, Inc.
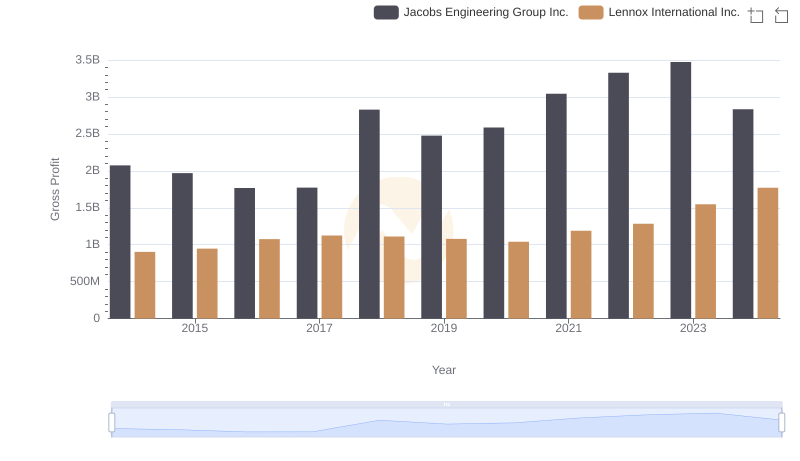
Who Generates Higher Gross Profit? Lennox International Inc. or Jacobs Engineering Group Inc.
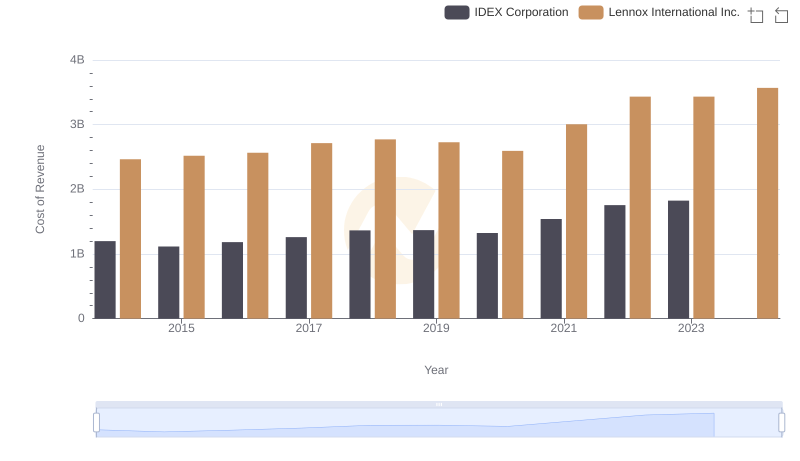
Cost of Revenue Trends: Lennox International Inc. vs IDEX Corporation
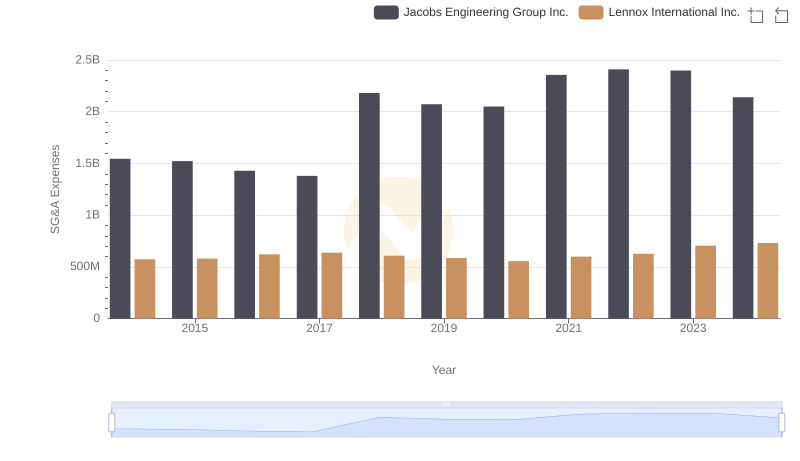
SG&A Efficiency Analysis: Comparing Lennox International Inc. and Jacobs Engineering Group Inc.
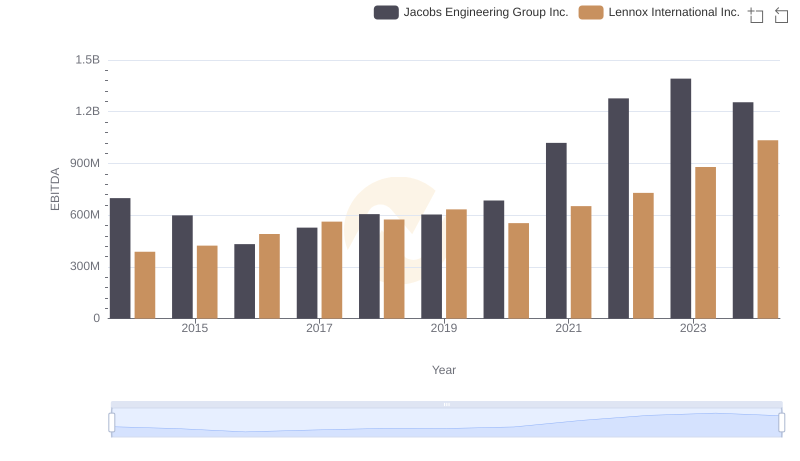
Lennox International Inc. and Jacobs Engineering Group Inc.: A Detailed Examination of EBITDA Performance