| __timestamp | Lennox International Inc. | Pentair plc |
|---|---|---|
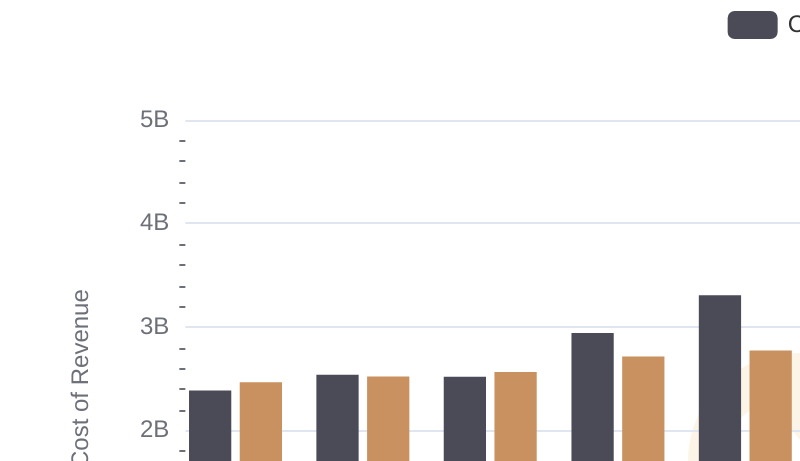
| Wednesday, January 1, 2014 | 2464100000 | 4563000000 |
| Thursday, January 1, 2015 | 2520000000 | 4263200000 |
| Friday, January 1, 2016 | 2565100000 | 3095900000 |
| Sunday, January 1, 2017 | 2714400000 | 3107400000 |
| Monday, January 1, 2018 | 2772700000 | 1917400000 |
| Tuesday, January 1, 2019 | 2727400000 | 1905700000 |
| Wednesday, January 1, 2020 | 2594000000 | 1960200000 |
| Friday, January 1, 2021 | 3005700000 | 2445600000 |
| Saturday, January 1, 2022 | 3433700000 | 2757200000 |
| Sunday, January 1, 2023 | 3434100000 | 2585300000 |
| Monday, January 1, 2024 | 3569400000 | 2484000000 |
Cracking the code
In the ever-evolving landscape of industrial manufacturing, understanding cost dynamics is crucial. Lennox International Inc. and Pentair plc, two giants in the sector, have shown intriguing trends in their cost of revenue over the past decade. From 2014 to 2023, Lennox International's cost of revenue has steadily increased by approximately 40%, peaking in 2023. In contrast, Pentair plc experienced a significant drop of nearly 60% from 2014 to 2019, followed by a gradual recovery. This divergence highlights the distinct strategic approaches of these companies. Lennox's consistent growth suggests a robust expansion strategy, while Pentair's fluctuations may indicate restructuring or market adaptation. Notably, data for 2024 is incomplete, leaving room for speculation on future trends. As these companies navigate the complexities of the global market, their cost management strategies will be pivotal in maintaining competitive advantage.
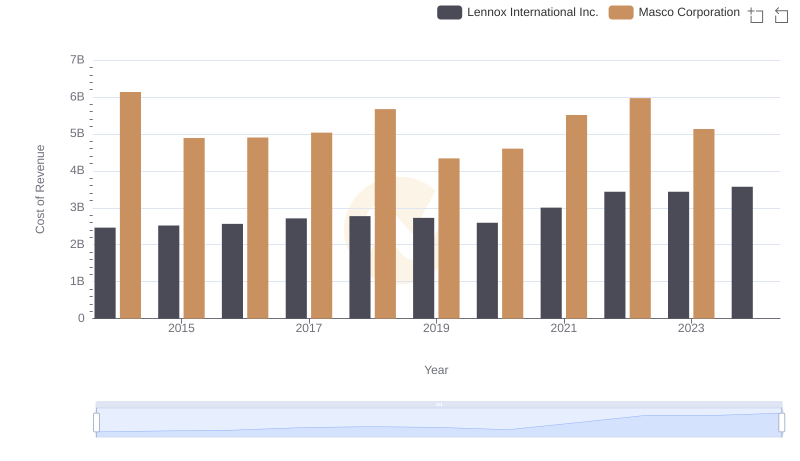
Analyzing Cost of Revenue: Lennox International Inc. and Masco Corporation
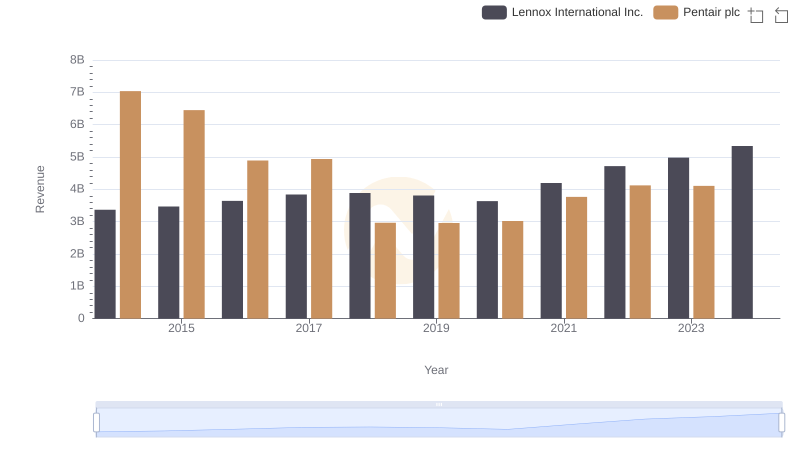
Lennox International Inc. and Pentair plc: A Comprehensive Revenue Analysis
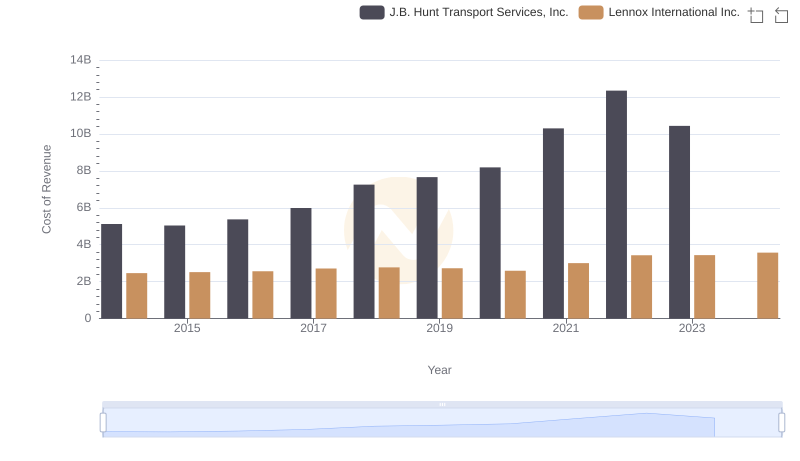
Comparing Cost of Revenue Efficiency: Lennox International Inc. vs J.B. Hunt Transport Services, Inc.
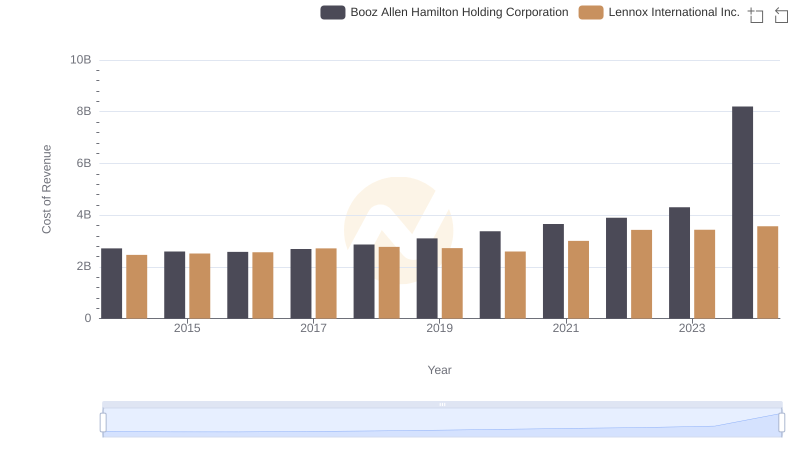
Analyzing Cost of Revenue: Lennox International Inc. and Booz Allen Hamilton Holding Corporation
Comparing Cost of Revenue Efficiency: Lennox International Inc. vs Carlisle Companies Incorporated
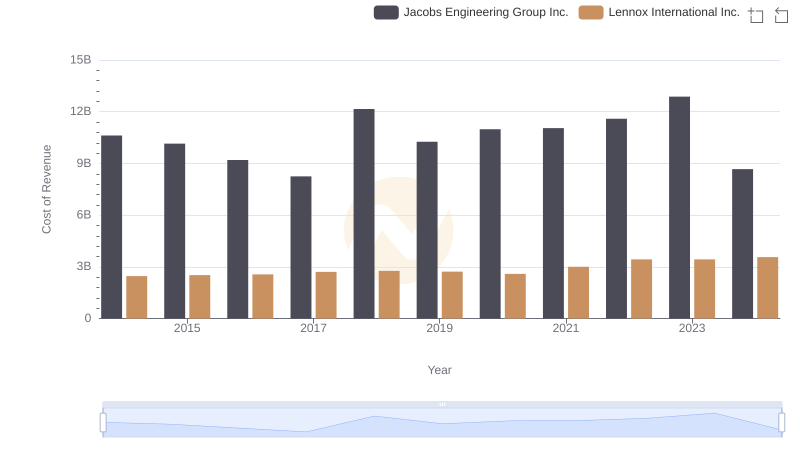
Cost of Revenue Trends: Lennox International Inc. vs Jacobs Engineering Group Inc.
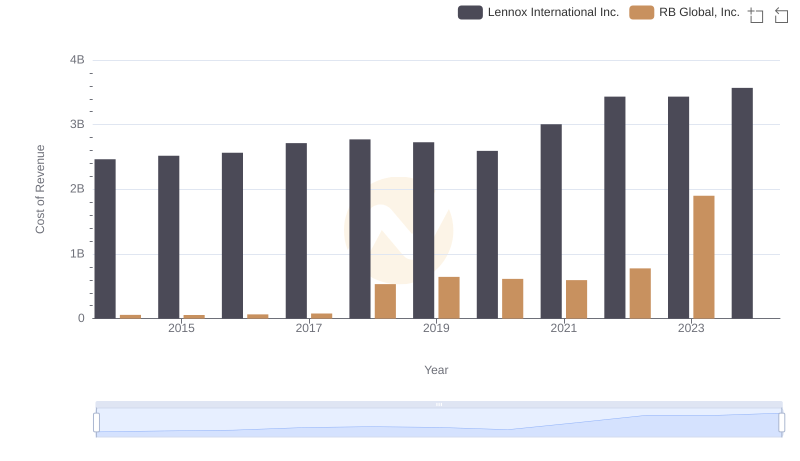
Cost of Revenue Comparison: Lennox International Inc. vs RB Global, Inc.
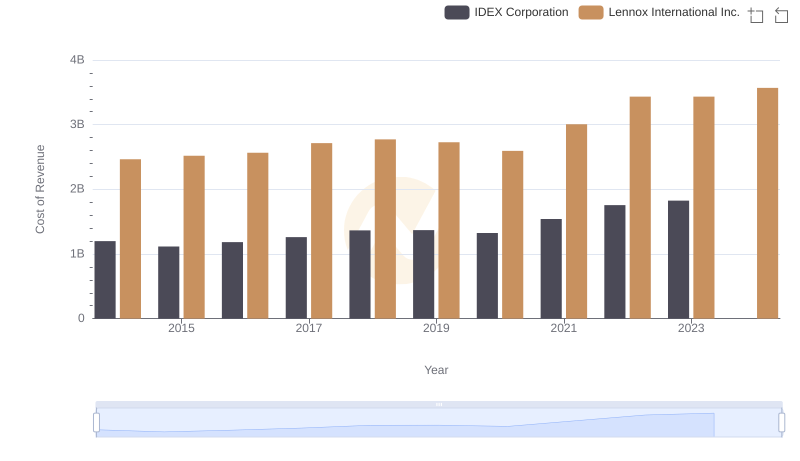
Cost of Revenue Trends: Lennox International Inc. vs IDEX Corporation
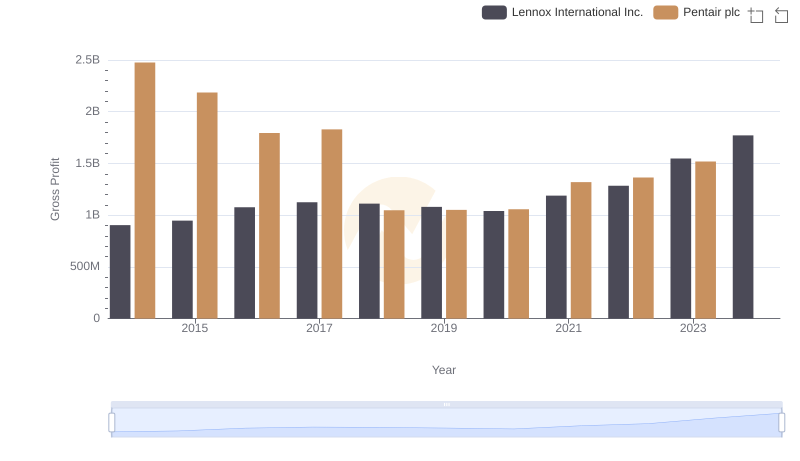
Gross Profit Analysis: Comparing Lennox International Inc. and Pentair plc
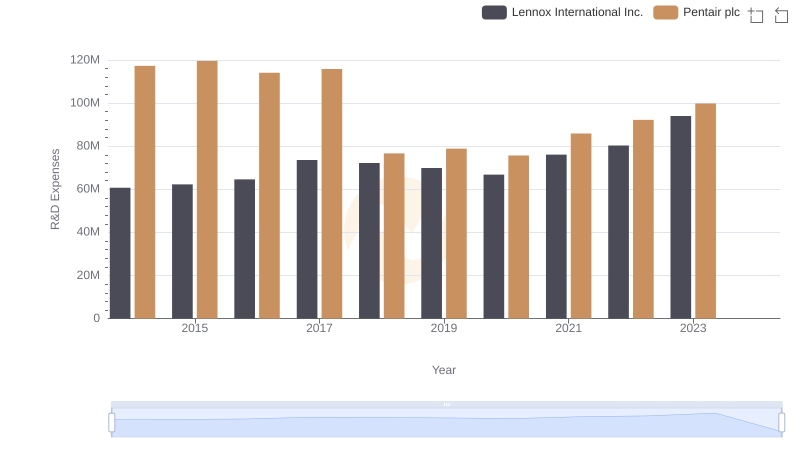
Lennox International Inc. vs Pentair plc: Strategic Focus on R&D Spending
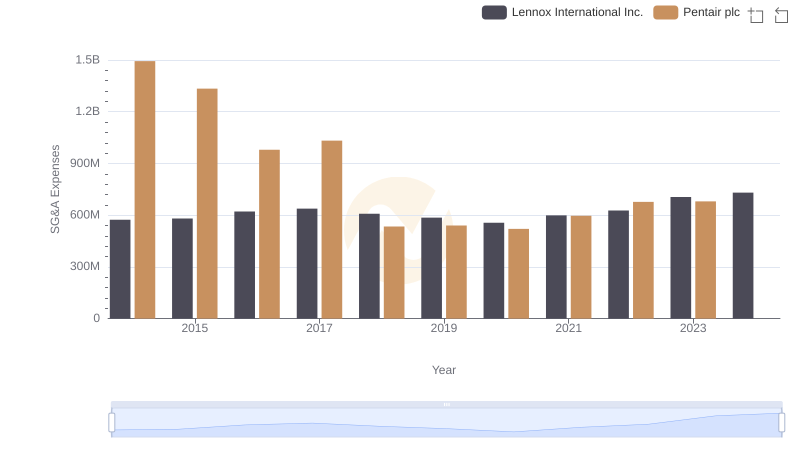
Lennox International Inc. and Pentair plc: SG&A Spending Patterns Compared
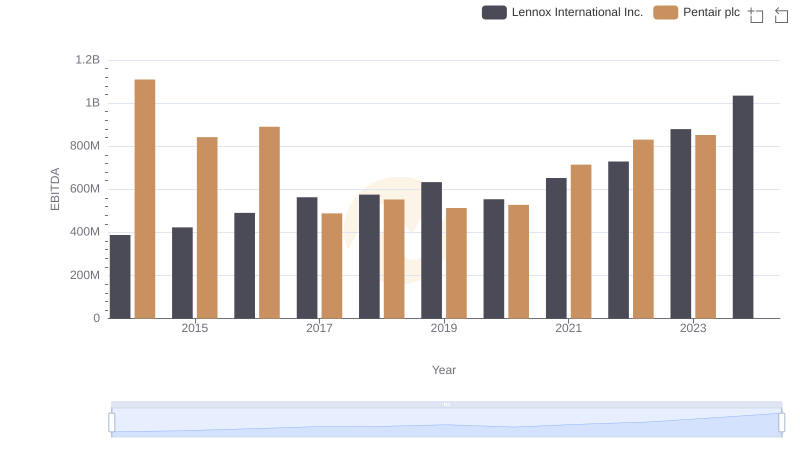
Comparative EBITDA Analysis: Lennox International Inc. vs Pentair plc