| __timestamp | IDEX Corporation | Lennox International Inc. |
|---|---|---|
| Wednesday, January 1, 2014 | 1198452000 | 2464100000 |
| Thursday, January 1, 2015 | 1116353000 | 2520000000 |
| Friday, January 1, 2016 | 1182276000 | 2565100000 |
| Sunday, January 1, 2017 | 1260634000 | 2714400000 |
| Monday, January 1, 2018 | 1365771000 | 2772700000 |
| Tuesday, January 1, 2019 | 1369539000 | 2727400000 |
| Wednesday, January 1, 2020 | 1324222000 | 2594000000 |
| Friday, January 1, 2021 | 1540300000 | 3005700000 |
| Saturday, January 1, 2022 | 1755000000 | 3433700000 |
| Sunday, January 1, 2023 | 1825400000 | 3434100000 |
| Monday, January 1, 2024 | 1814000000 | 3569400000 |
Unleashing the power of data
In the ever-evolving landscape of industrial manufacturing, understanding cost dynamics is crucial. Lennox International Inc. and IDEX Corporation, two giants in their respective fields, have shown intriguing trends in their cost of revenue over the past decade. From 2014 to 2023, Lennox International Inc. consistently reported higher costs, peaking at approximately $3.43 billion in 2023, a 39% increase from 2014. In contrast, IDEX Corporation's cost of revenue rose by 52% over the same period, reaching around $1.83 billion in 2023. This divergence highlights Lennox's larger scale of operations, while IDEX's rapid growth reflects its strategic expansions. Notably, Lennox's data for 2024 is available, showing a further increase, whereas IDEX's data is missing, indicating potential reporting delays or strategic shifts. These insights offer a window into the operational strategies and market positioning of these industrial leaders.
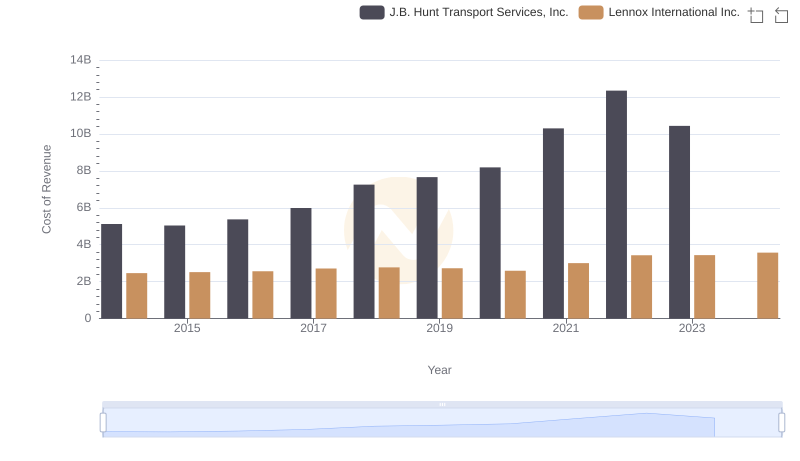
Comparing Cost of Revenue Efficiency: Lennox International Inc. vs J.B. Hunt Transport Services, Inc.
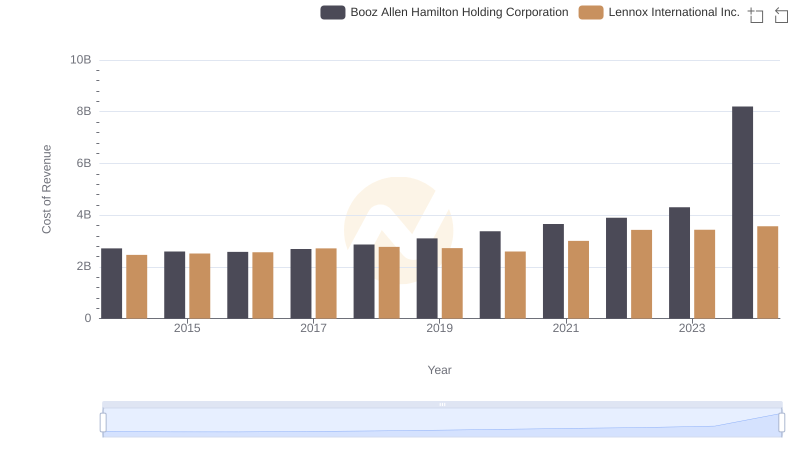
Analyzing Cost of Revenue: Lennox International Inc. and Booz Allen Hamilton Holding Corporation
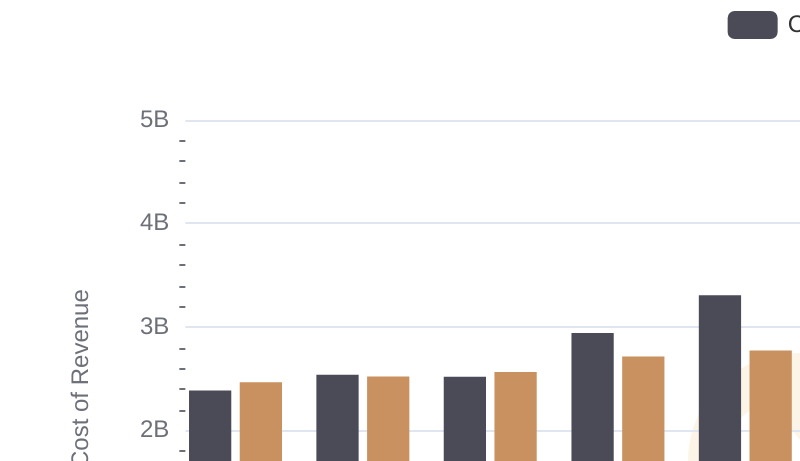
Comparing Cost of Revenue Efficiency: Lennox International Inc. vs Carlisle Companies Incorporated
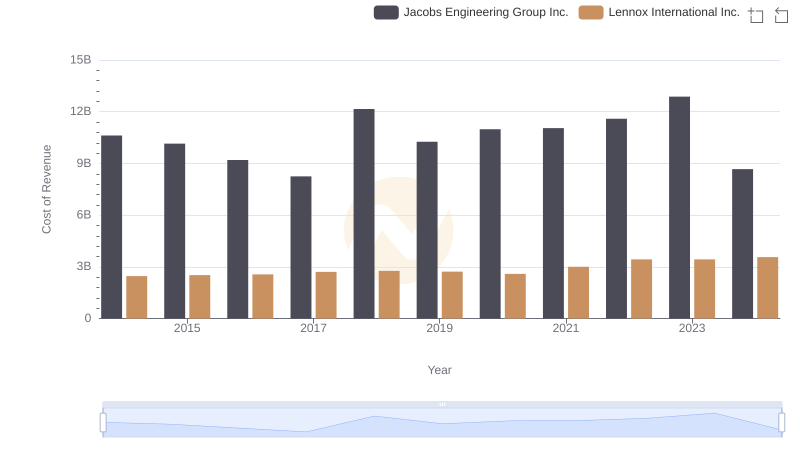
Cost of Revenue Trends: Lennox International Inc. vs Jacobs Engineering Group Inc.
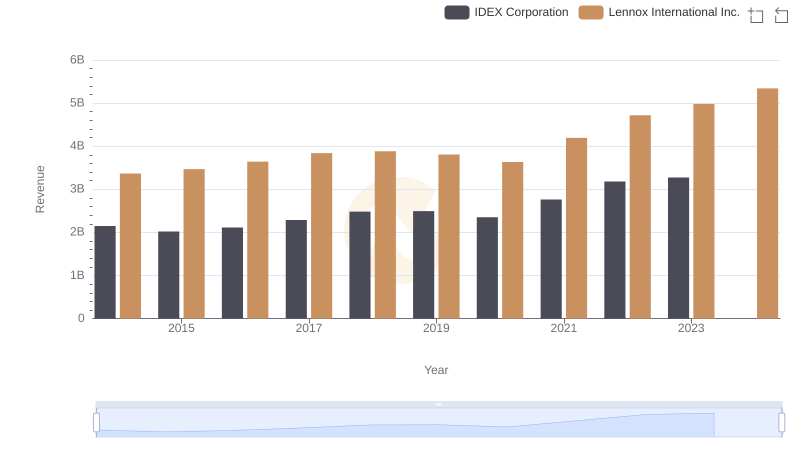
Who Generates More Revenue? Lennox International Inc. or IDEX Corporation
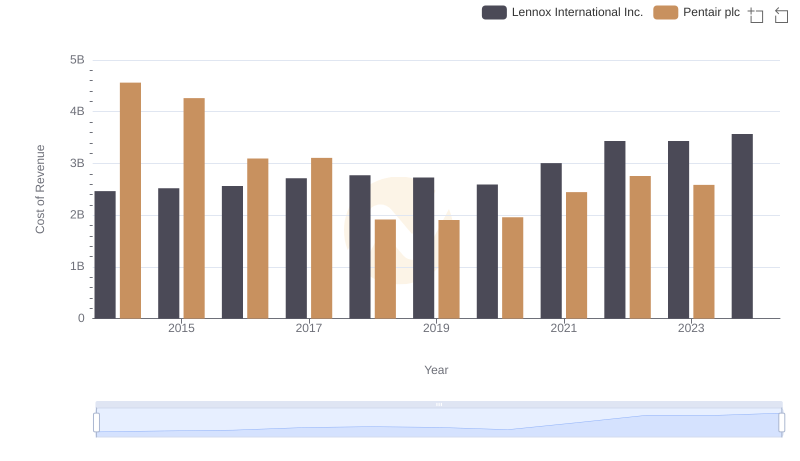
Cost Insights: Breaking Down Lennox International Inc. and Pentair plc's Expenses
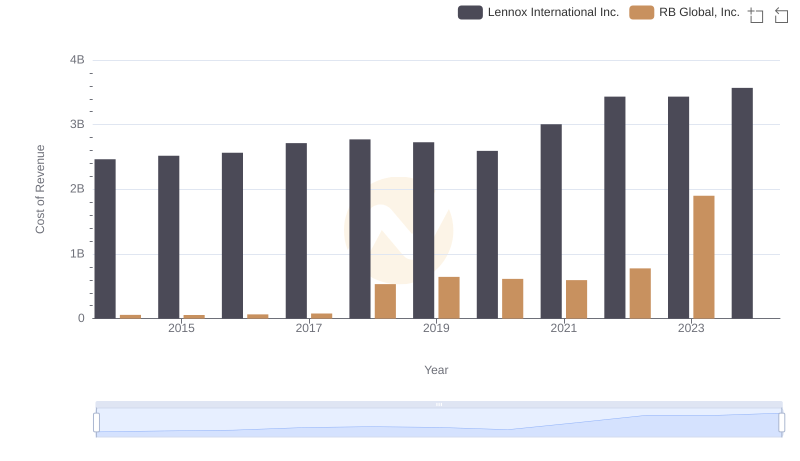
Cost of Revenue Comparison: Lennox International Inc. vs RB Global, Inc.
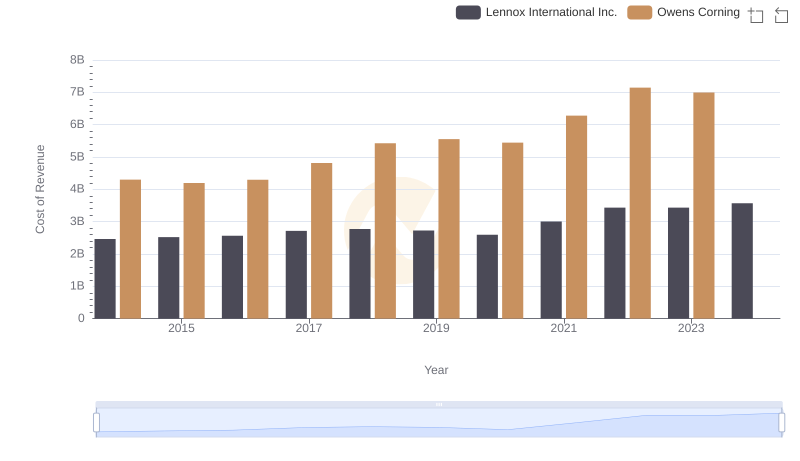
Cost Insights: Breaking Down Lennox International Inc. and Owens Corning's Expenses
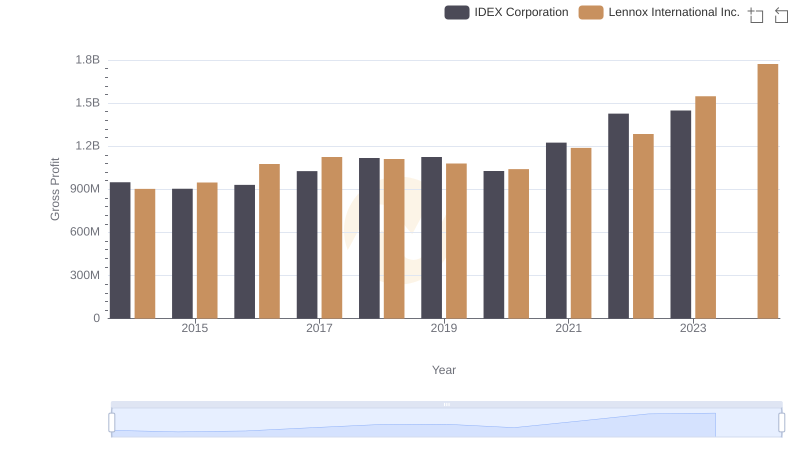
Gross Profit Comparison: Lennox International Inc. and IDEX Corporation Trends
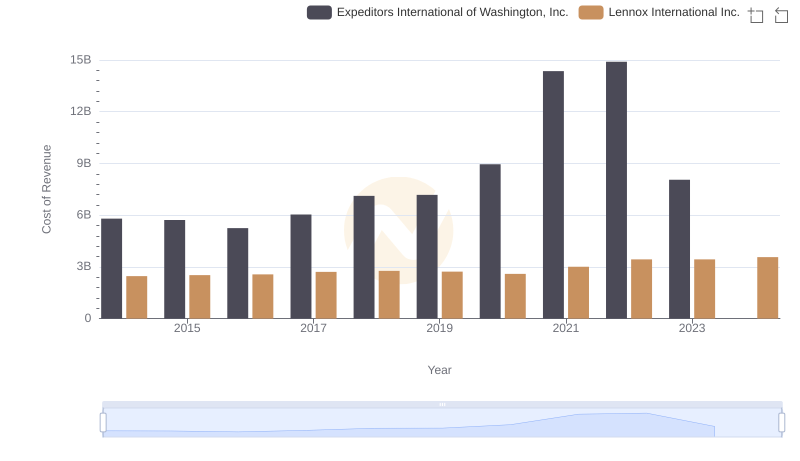
Cost Insights: Breaking Down Lennox International Inc. and Expeditors International of Washington, Inc.'s Expenses
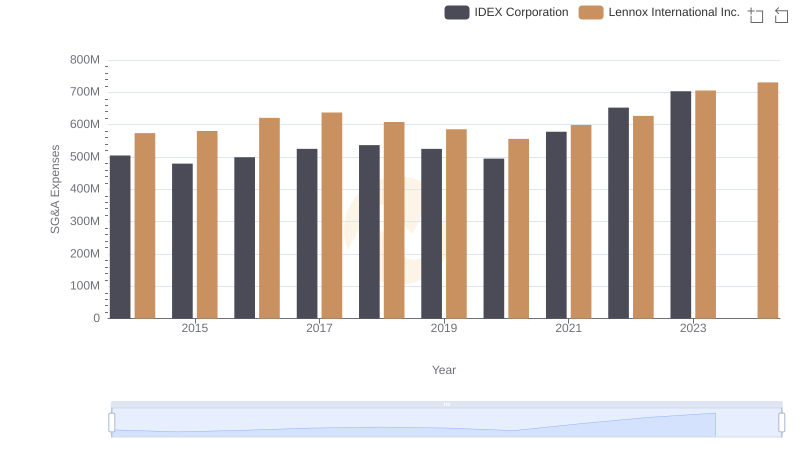
Lennox International Inc. vs IDEX Corporation: SG&A Expense Trends
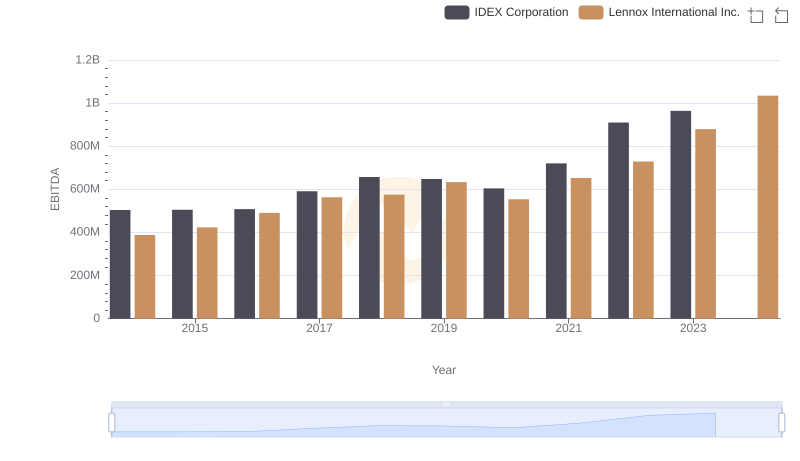
A Professional Review of EBITDA: Lennox International Inc. Compared to IDEX Corporation