| __timestamp | Lennox International Inc. | Owens Corning |
|---|---|---|
| Wednesday, January 1, 2014 | 60700000 | 76000000 |
| Thursday, January 1, 2015 | 62300000 | 73000000 |
| Friday, January 1, 2016 | 64599999 | 82000000 |
| Sunday, January 1, 2017 | 73600000 | 85000000 |
| Monday, January 1, 2018 | 72200000 | 89000000 |
| Tuesday, January 1, 2019 | 69900000 | 87000000 |
| Wednesday, January 1, 2020 | 66800000 | 82000000 |
| Friday, January 1, 2021 | 76100000 | 91000000 |
| Saturday, January 1, 2022 | 80300000 | 106000000 |
| Sunday, January 1, 2023 | 94000000 | 123000000 |
| Monday, January 1, 2024 | 0 |
Data in motion
In the ever-evolving landscape of industrial innovation, research and development (R&D) play a pivotal role in shaping the future. Lennox International Inc. and Owens Corning, two giants in their respective fields, have demonstrated varied approaches to R&D investments over the past decade. From 2014 to 2023, Lennox International Inc. increased its R&D spending by approximately 55%, peaking in 2023. Meanwhile, Owens Corning's R&D expenses surged by over 60% during the same period, reflecting a robust commitment to innovation.
While both companies have shown a consistent upward trend, Owens Corning's R&D expenditure consistently outpaced Lennox International Inc., highlighting its aggressive strategy in technological advancement. Notably, the data for 2024 is incomplete, suggesting a potential shift or pause in Lennox's R&D activities. This analysis underscores the critical role of R&D in maintaining competitive advantage and driving industry progress.
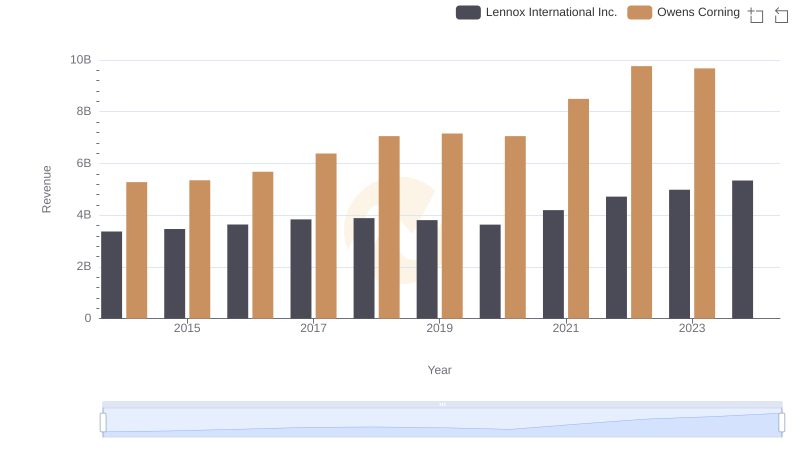
Lennox International Inc. and Owens Corning: A Comprehensive Revenue Analysis
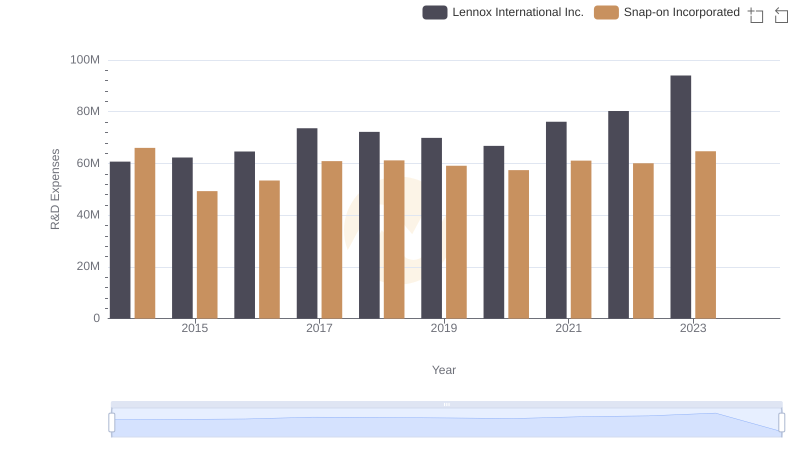
Comparing Innovation Spending: Lennox International Inc. and Snap-on Incorporated
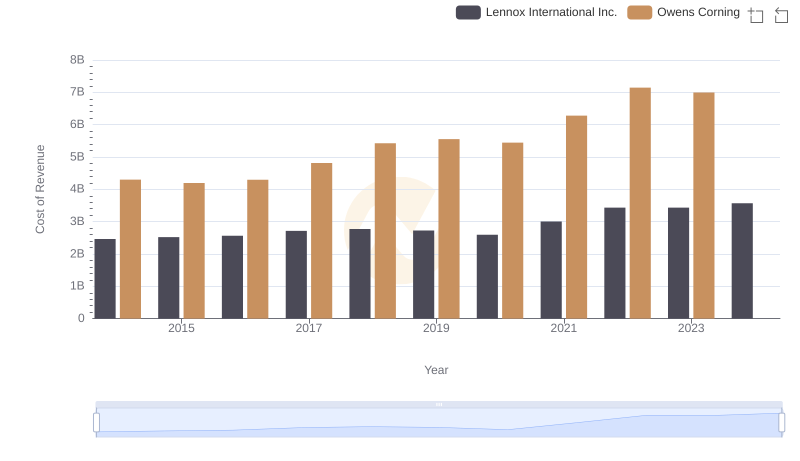
Cost Insights: Breaking Down Lennox International Inc. and Owens Corning's Expenses
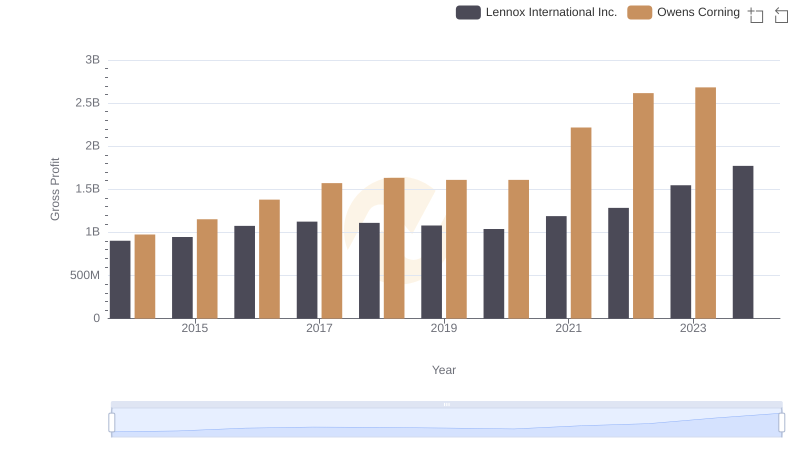
Gross Profit Analysis: Comparing Lennox International Inc. and Owens Corning
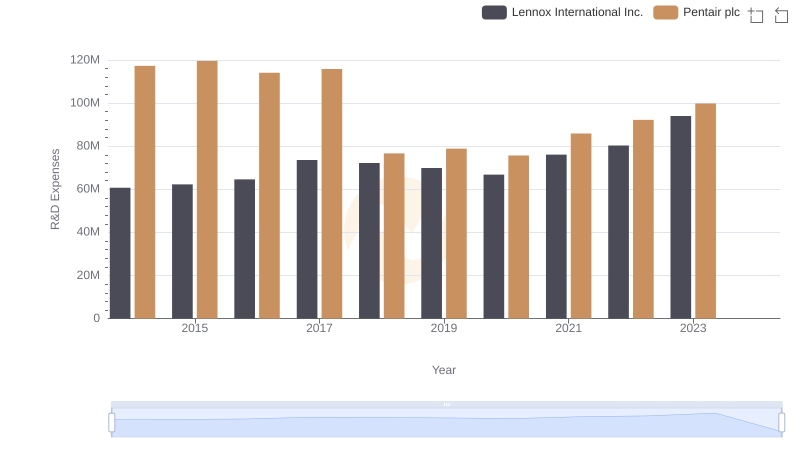
Lennox International Inc. vs Pentair plc: Strategic Focus on R&D Spending
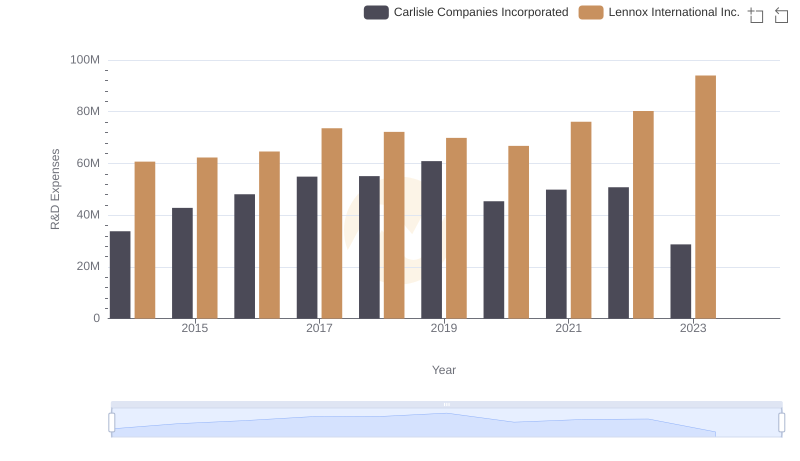
Analyzing R&D Budgets: Lennox International Inc. vs Carlisle Companies Incorporated
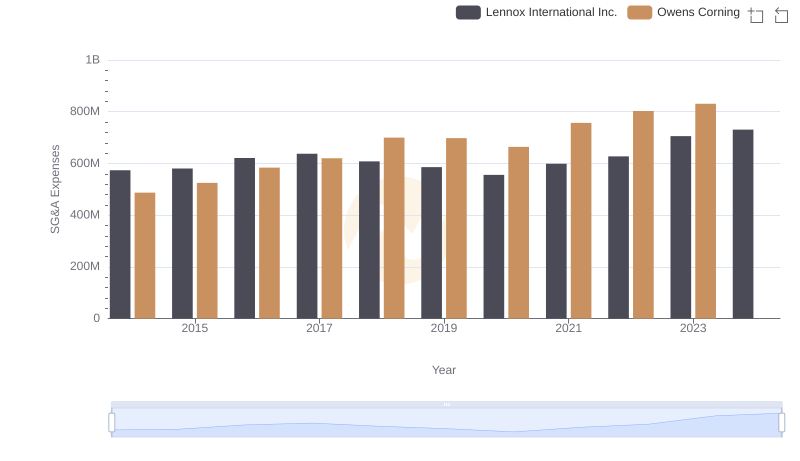
Lennox International Inc. or Owens Corning: Who Manages SG&A Costs Better?
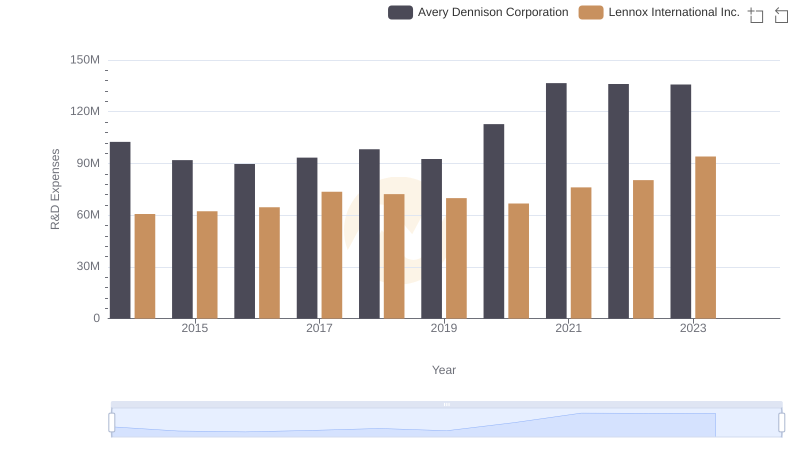
Lennox International Inc. or Avery Dennison Corporation: Who Invests More in Innovation?
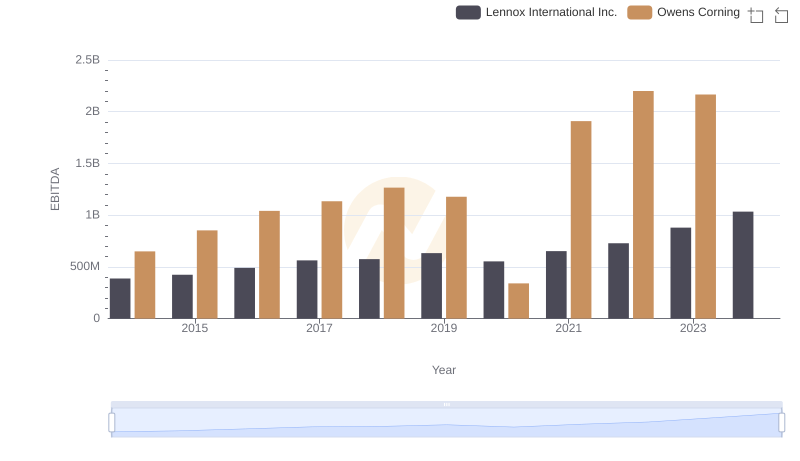
Comparative EBITDA Analysis: Lennox International Inc. vs Owens Corning
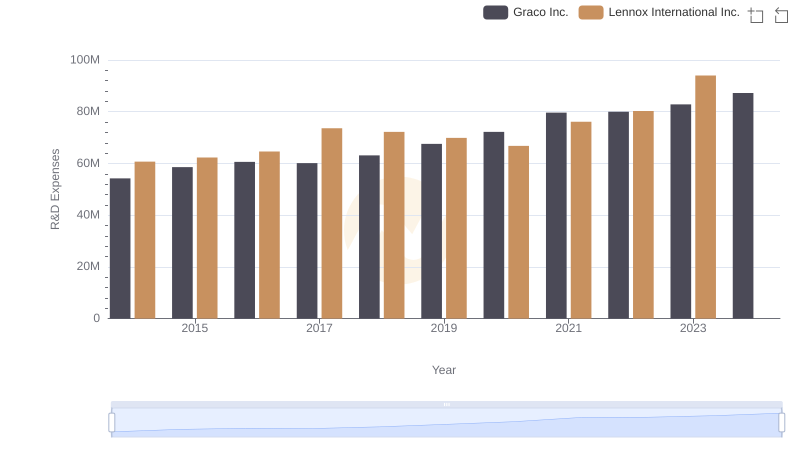
Lennox International Inc. or Graco Inc.: Who Invests More in Innovation?
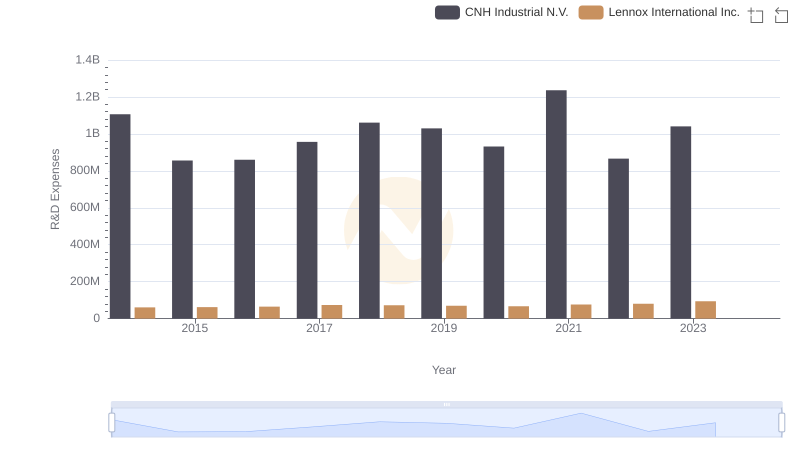
Comparing Innovation Spending: Lennox International Inc. and CNH Industrial N.V.
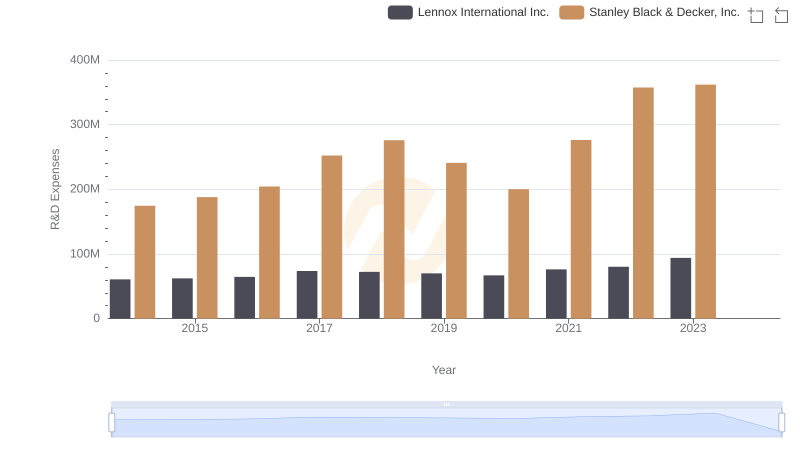
Research and Development: Comparing Key Metrics for Lennox International Inc. and Stanley Black & Decker, Inc.