| __timestamp | Lennox International Inc. | XPO Logistics, Inc. |
|---|---|---|
| Wednesday, January 1, 2014 | 2464100000 | 1975000000 |
| Thursday, January 1, 2015 | 2520000000 | 6538400000 |
| Friday, January 1, 2016 | 2565100000 | 12480100000 |
| Sunday, January 1, 2017 | 2714400000 | 13101100000 |
| Monday, January 1, 2018 | 2772700000 | 14738000000 |
| Tuesday, January 1, 2019 | 2727400000 | 13982000000 |
| Wednesday, January 1, 2020 | 2594000000 | 13689000000 |
| Friday, January 1, 2021 | 3005700000 | 10812000000 |
| Saturday, January 1, 2022 | 3433700000 | 6491000000 |
| Sunday, January 1, 2023 | 3434100000 | 6974000000 |
| Monday, January 1, 2024 | 3569400000 | 7157000000 |
Unveiling the hidden dimensions of data
In the ever-evolving landscape of industrial giants, Lennox International Inc. and XPO Logistics, Inc. have showcased intriguing trends in cost efficiency over the past decade. From 2014 to 2023, Lennox International Inc. demonstrated a steady increase in cost of revenue, peaking at approximately $3.57 billion in 2024, marking a 45% rise from 2014. Meanwhile, XPO Logistics, Inc. experienced a more volatile trajectory, with costs surging to a high of $14.74 billion in 2018 before declining to $6.97 billion in 2023. This fluctuation highlights the dynamic nature of logistics and supply chain management. Notably, the absence of data for XPO in 2024 suggests a potential shift or restructuring. As these companies navigate the complexities of their industries, understanding their cost efficiency strategies offers valuable insights into their operational resilience and market adaptability.
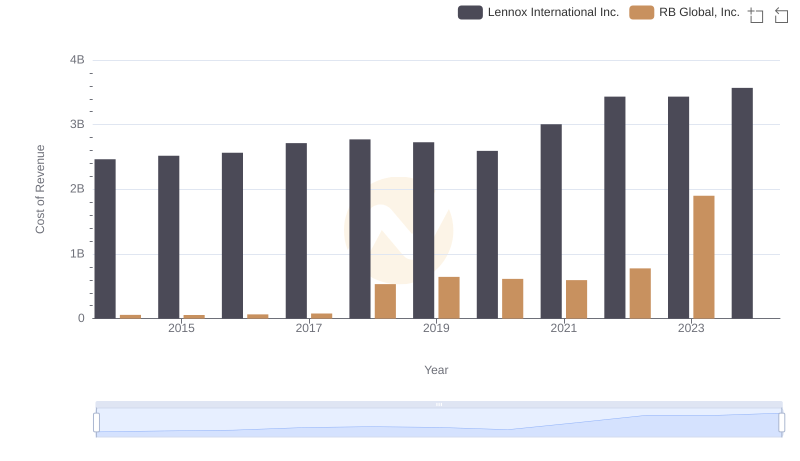
Cost of Revenue Comparison: Lennox International Inc. vs RB Global, Inc.
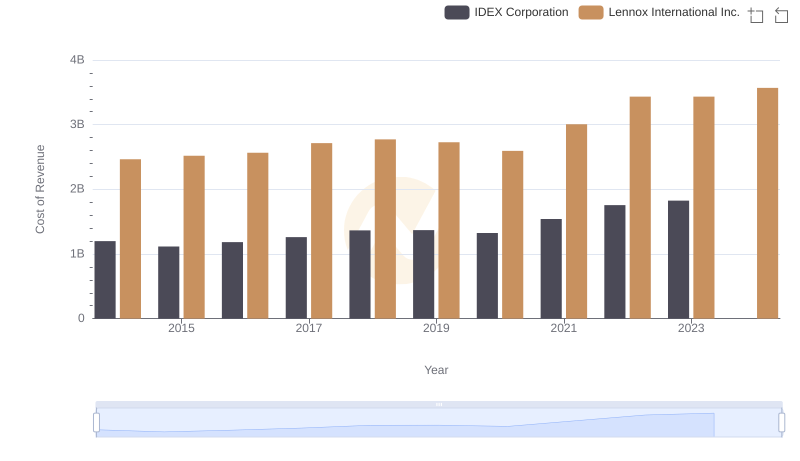
Cost of Revenue Trends: Lennox International Inc. vs IDEX Corporation
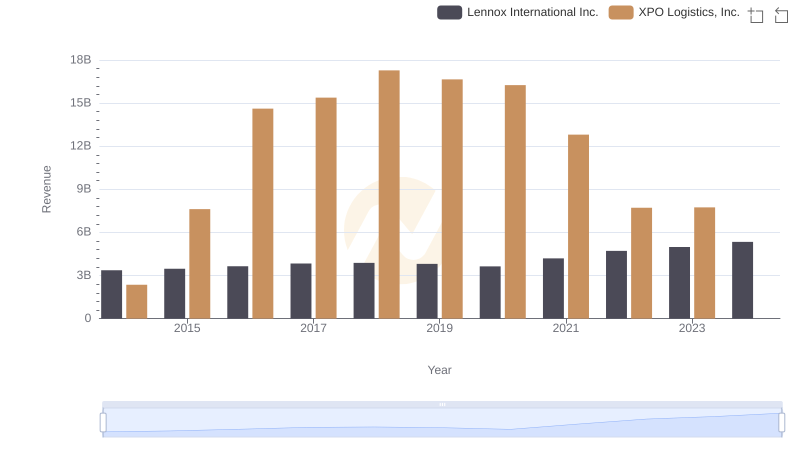
Revenue Showdown: Lennox International Inc. vs XPO Logistics, Inc.
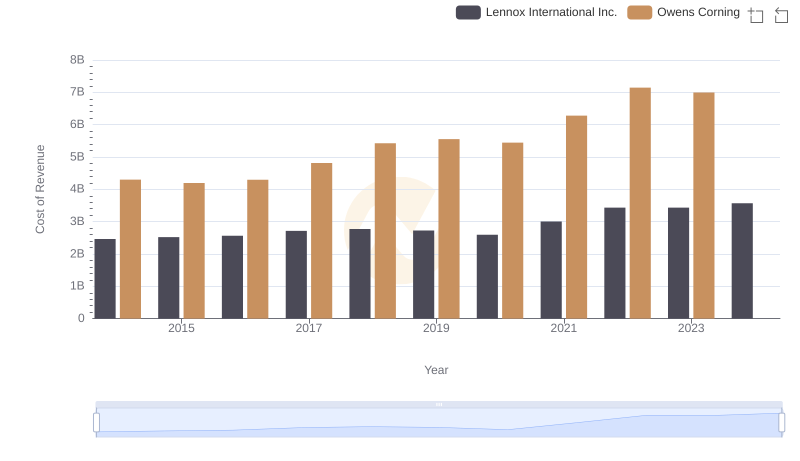
Cost Insights: Breaking Down Lennox International Inc. and Owens Corning's Expenses
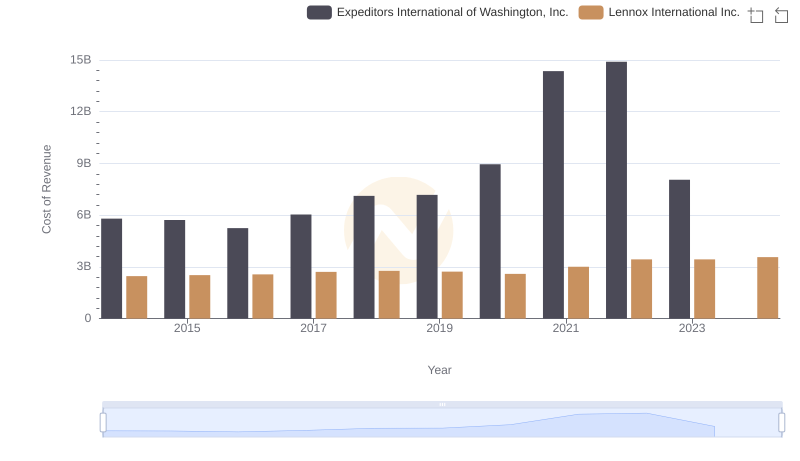
Cost Insights: Breaking Down Lennox International Inc. and Expeditors International of Washington, Inc.'s Expenses
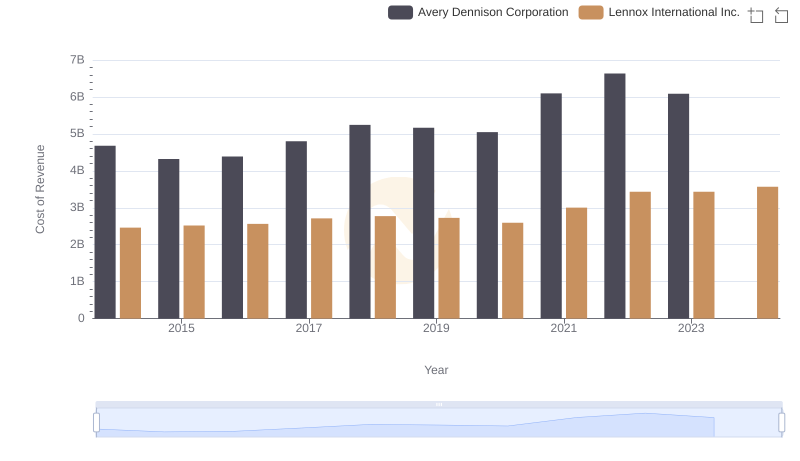
Cost of Revenue Comparison: Lennox International Inc. vs Avery Dennison Corporation
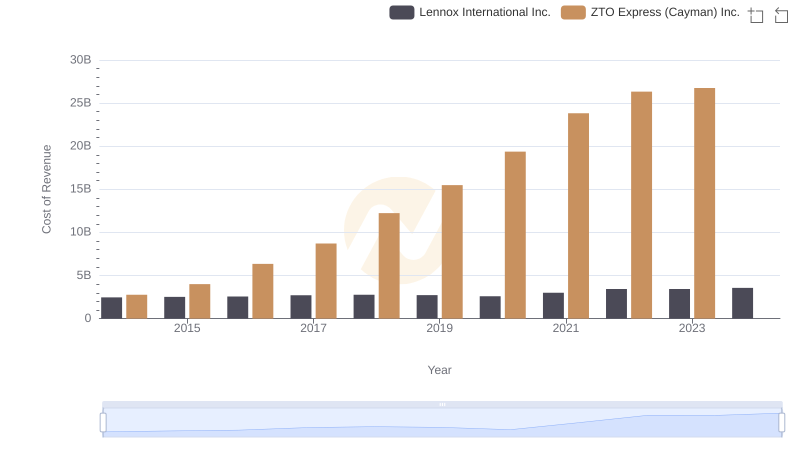
Lennox International Inc. vs ZTO Express (Cayman) Inc.: Efficiency in Cost of Revenue Explored
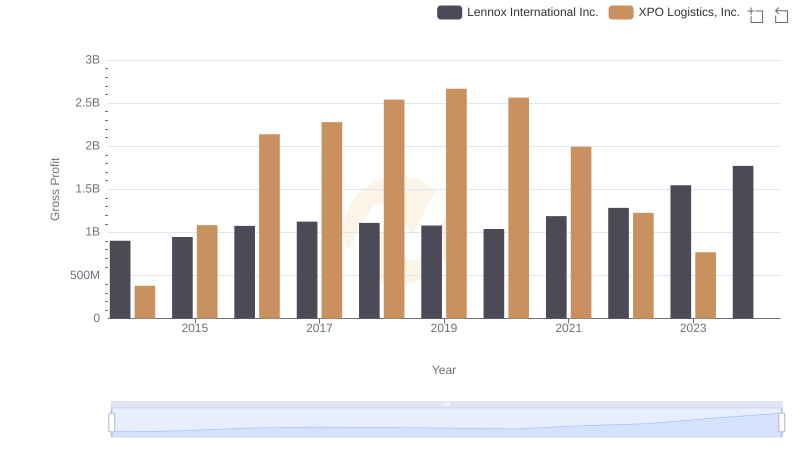
Gross Profit Comparison: Lennox International Inc. and XPO Logistics, Inc. Trends
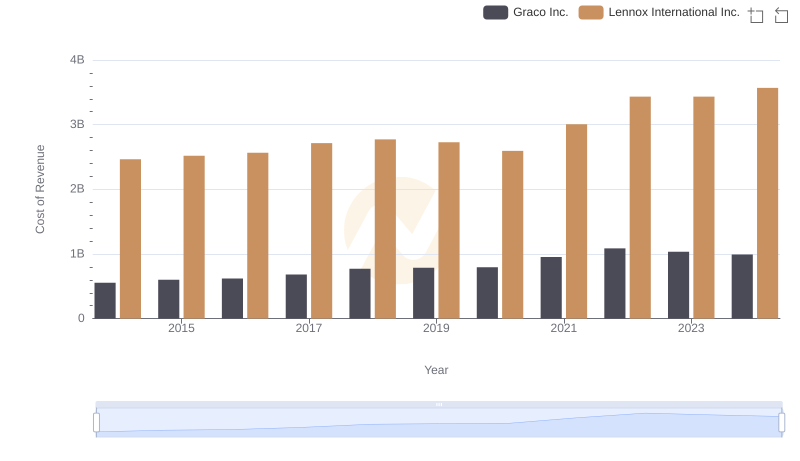
Cost of Revenue Comparison: Lennox International Inc. vs Graco Inc.
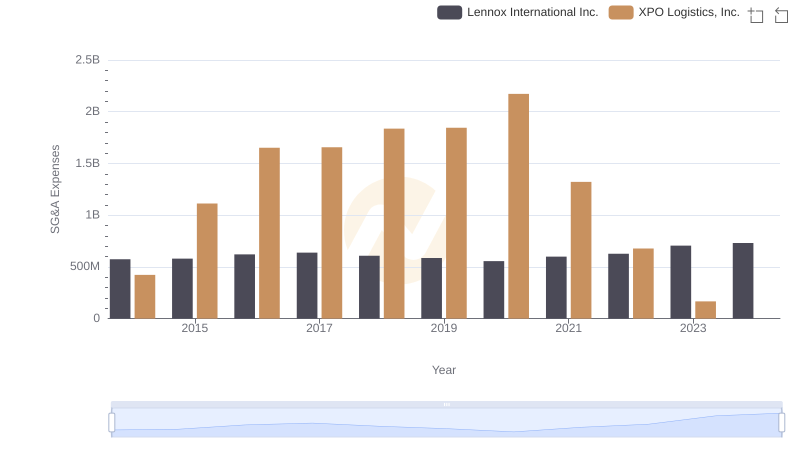
Lennox International Inc. vs XPO Logistics, Inc.: SG&A Expense Trends
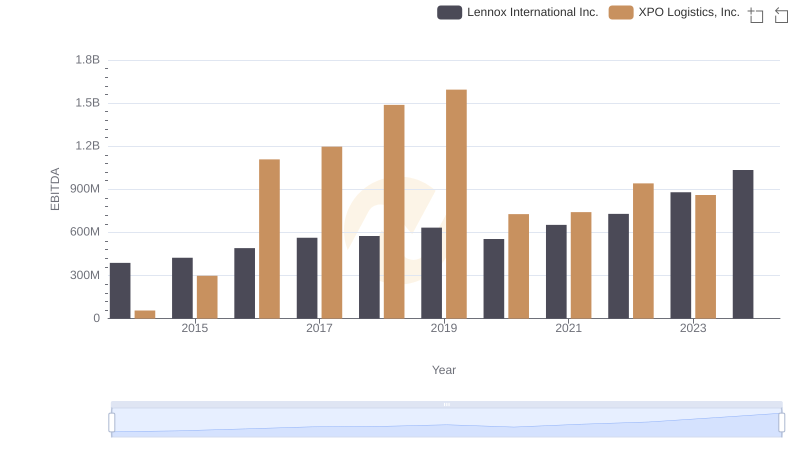
A Professional Review of EBITDA: Lennox International Inc. Compared to XPO Logistics, Inc.