| __timestamp | Lennox International Inc. | Owens Corning |
|---|---|---|
| Wednesday, January 1, 2014 | 903300000 | 976000000 |
| Thursday, January 1, 2015 | 947400000 | 1153000000 |
| Friday, January 1, 2016 | 1076500000 | 1381000000 |
| Sunday, January 1, 2017 | 1125200000 | 1572000000 |
| Monday, January 1, 2018 | 1111200000 | 1632000000 |
| Tuesday, January 1, 2019 | 1079800000 | 1609000000 |
| Wednesday, January 1, 2020 | 1040100000 | 1610000000 |
| Friday, January 1, 2021 | 1188400000 | 2217000000 |
| Saturday, January 1, 2022 | 1284700000 | 2616000000 |
| Sunday, January 1, 2023 | 1547800000 | 2683000000 |
| Monday, January 1, 2024 | 1771900000 |
Unlocking the unknown
In the competitive landscape of industrial manufacturing, Lennox International Inc. and Owens Corning have showcased intriguing trends in gross profit over the past decade. From 2014 to 2023, Lennox International Inc. has seen a steady increase in gross profit, growing by approximately 96%, from $903 million to $1.55 billion. Meanwhile, Owens Corning has experienced a remarkable 175% surge, reaching $2.68 billion in 2023 from $976 million in 2014.
The year 2021 marked a significant turning point for both companies, with Owens Corning's gross profit surpassing the $2 billion mark, while Lennox International Inc. crossed the $1 billion threshold. However, data for 2024 remains incomplete, leaving room for speculation on future trends. This analysis highlights the resilience and growth potential of these industry giants, offering valuable insights for investors and market analysts alike.
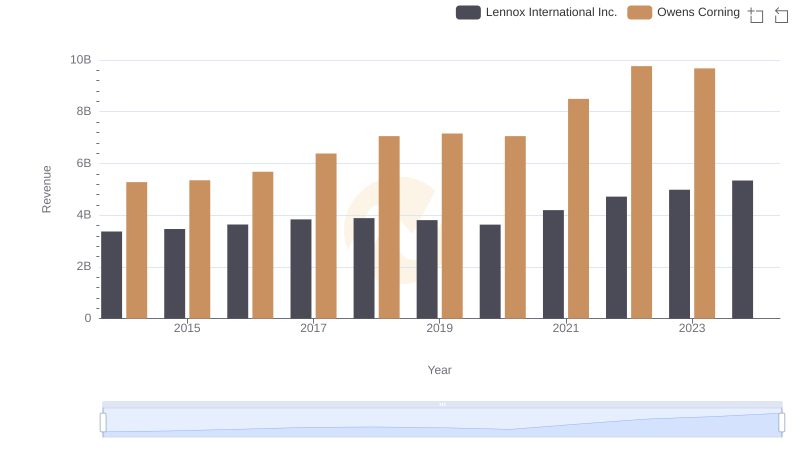
Lennox International Inc. and Owens Corning: A Comprehensive Revenue Analysis
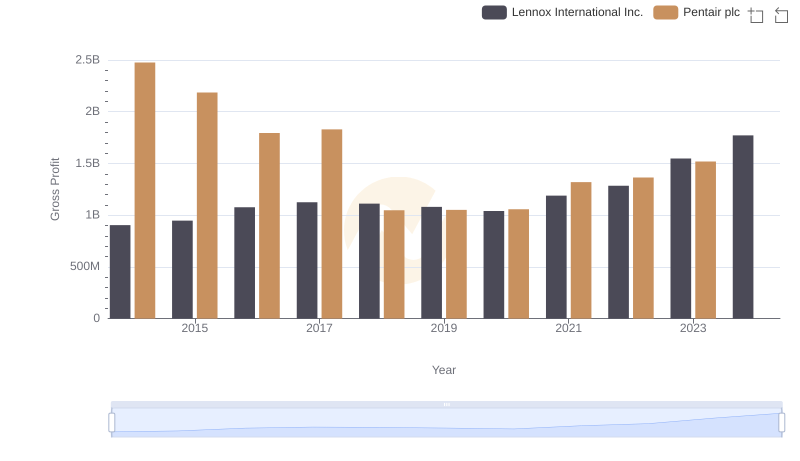
Gross Profit Analysis: Comparing Lennox International Inc. and Pentair plc
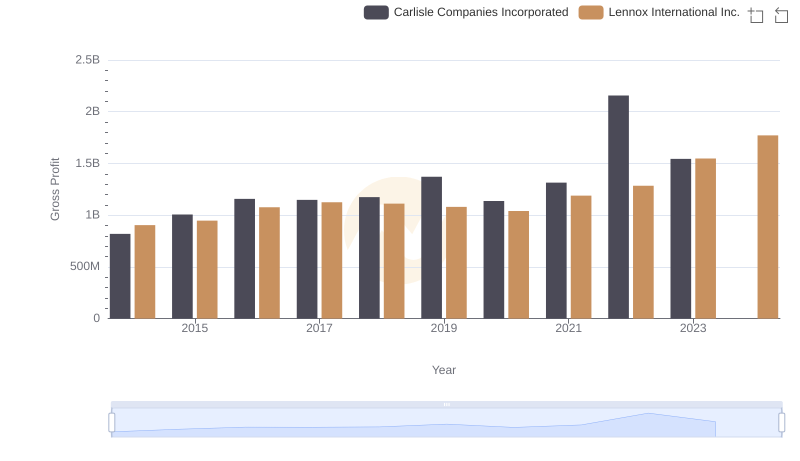
Gross Profit Trends Compared: Lennox International Inc. vs Carlisle Companies Incorporated
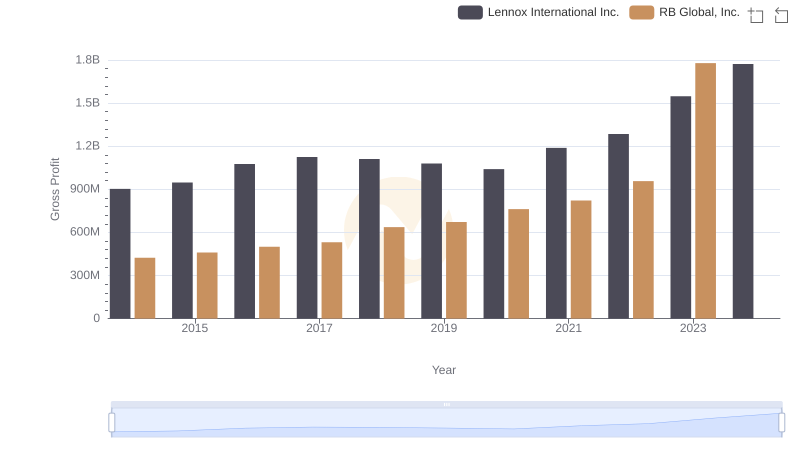
Lennox International Inc. vs RB Global, Inc.: A Gross Profit Performance Breakdown
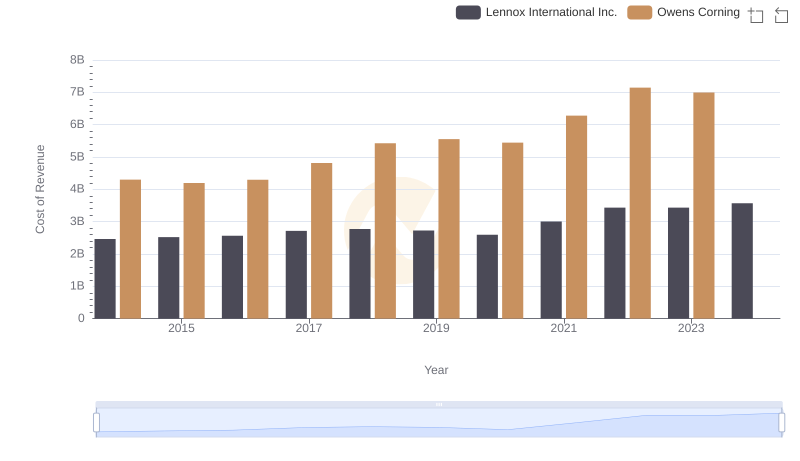
Cost Insights: Breaking Down Lennox International Inc. and Owens Corning's Expenses
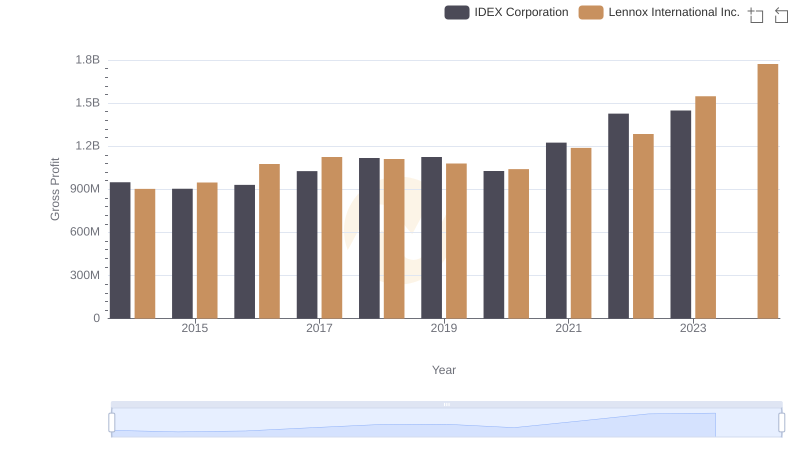
Gross Profit Comparison: Lennox International Inc. and IDEX Corporation Trends
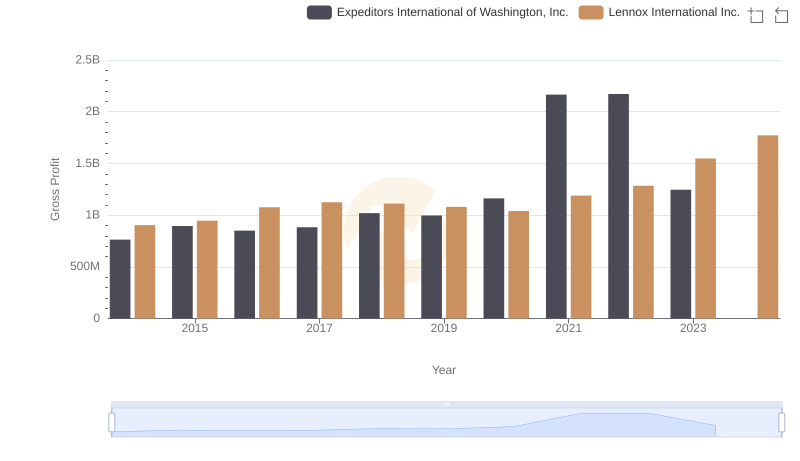
Gross Profit Trends Compared: Lennox International Inc. vs Expeditors International of Washington, Inc.
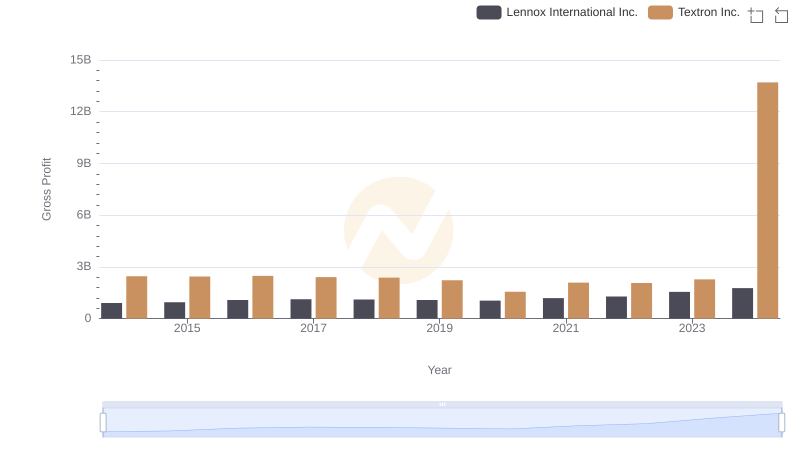
Gross Profit Comparison: Lennox International Inc. and Textron Inc. Trends
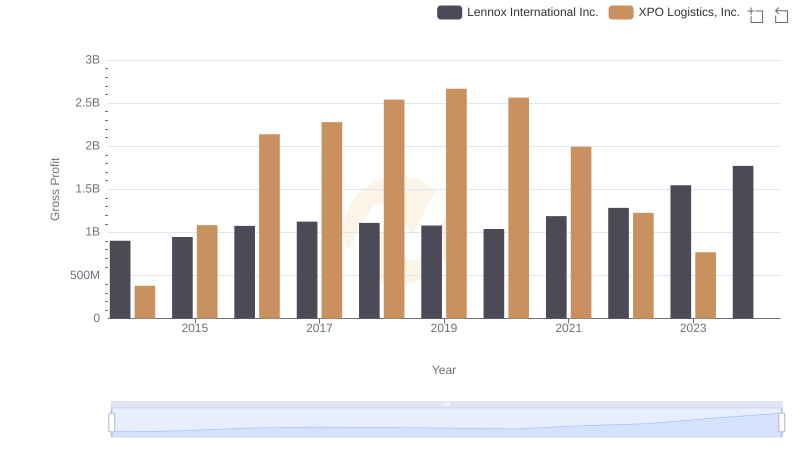
Gross Profit Comparison: Lennox International Inc. and XPO Logistics, Inc. Trends
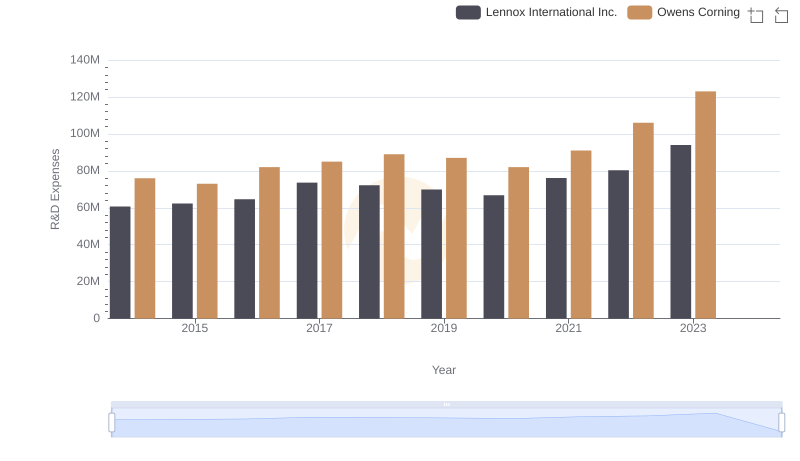
Research and Development: Comparing Key Metrics for Lennox International Inc. and Owens Corning
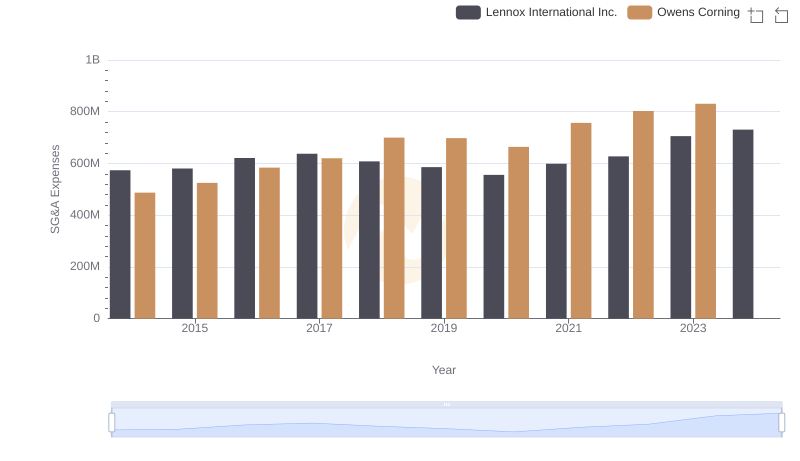
Lennox International Inc. or Owens Corning: Who Manages SG&A Costs Better?
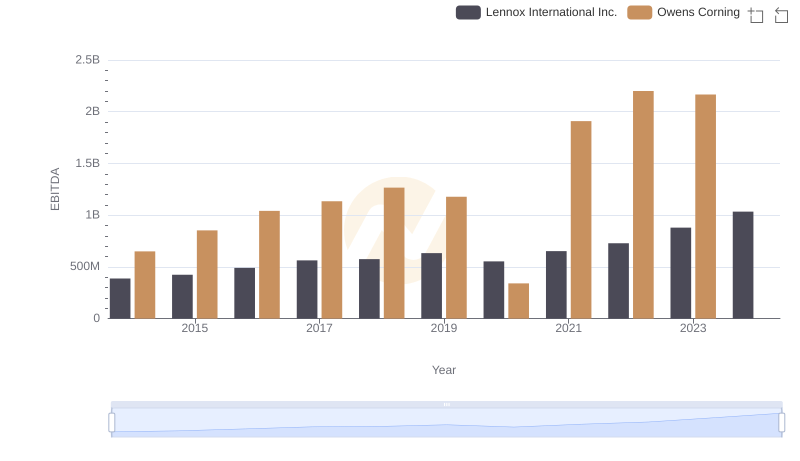
Comparative EBITDA Analysis: Lennox International Inc. vs Owens Corning