| __timestamp | Lennox International Inc. | Owens Corning |
|---|---|---|
| Wednesday, January 1, 2014 | 3367400000 | 5276000000 |
| Thursday, January 1, 2015 | 3467400000 | 5350000000 |
| Friday, January 1, 2016 | 3641600000 | 5677000000 |
| Sunday, January 1, 2017 | 3839600000 | 6384000000 |
| Monday, January 1, 2018 | 3883900000 | 7057000000 |
| Tuesday, January 1, 2019 | 3807200000 | 7160000000 |
| Wednesday, January 1, 2020 | 3634100000 | 7055000000 |
| Friday, January 1, 2021 | 4194100000 | 8498000000 |
| Saturday, January 1, 2022 | 4718400000 | 9761000000 |
| Sunday, January 1, 2023 | 4981900000 | 9677000000 |
| Monday, January 1, 2024 | 5341300000 |
Igniting the spark of knowledge
In the ever-evolving landscape of industrial manufacturing, Lennox International Inc. and Owens Corning have emerged as formidable players. Over the past decade, Lennox International has seen its revenue grow by approximately 59%, from $3.37 billion in 2014 to an impressive $5.34 billion in 2024. Meanwhile, Owens Corning has experienced a remarkable 84% increase, reaching a peak of $9.76 billion in 2022.
Lennox International's steady growth reflects its strategic focus on innovation and market expansion. In contrast, Owens Corning's revenue trajectory showcases its resilience and adaptability, particularly in the face of economic challenges. Notably, Owens Corning's data for 2024 is missing, leaving room for speculation about its future performance. As these industry giants continue to evolve, their financial narratives offer valuable insights into the broader economic landscape.
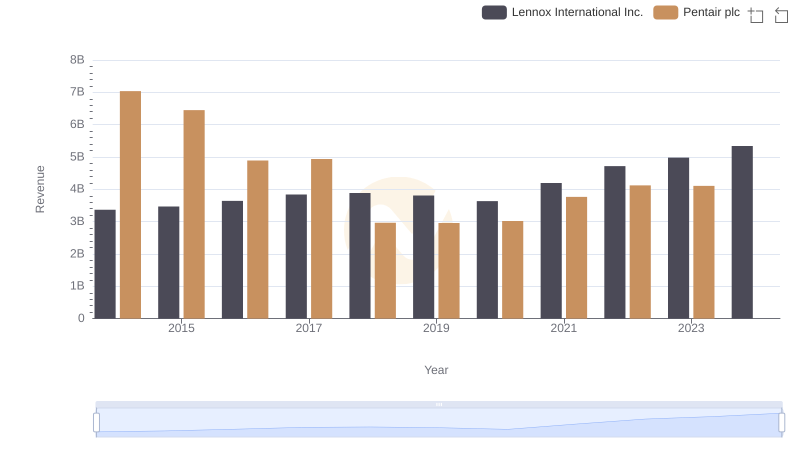
Lennox International Inc. and Pentair plc: A Comprehensive Revenue Analysis
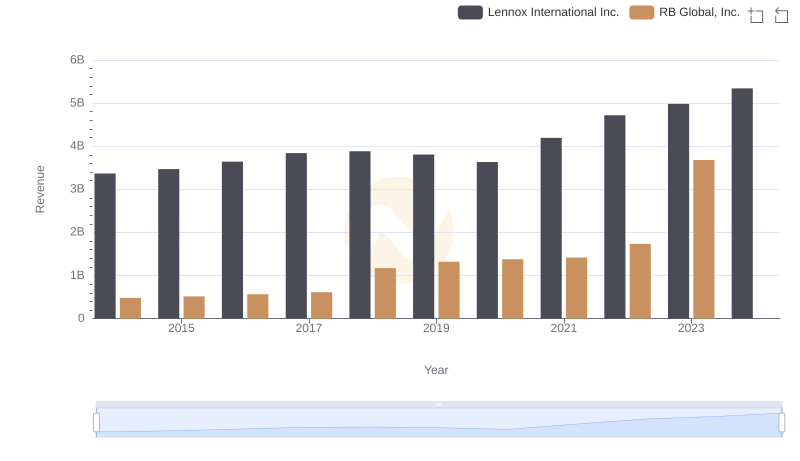
Comparing Revenue Performance: Lennox International Inc. or RB Global, Inc.?
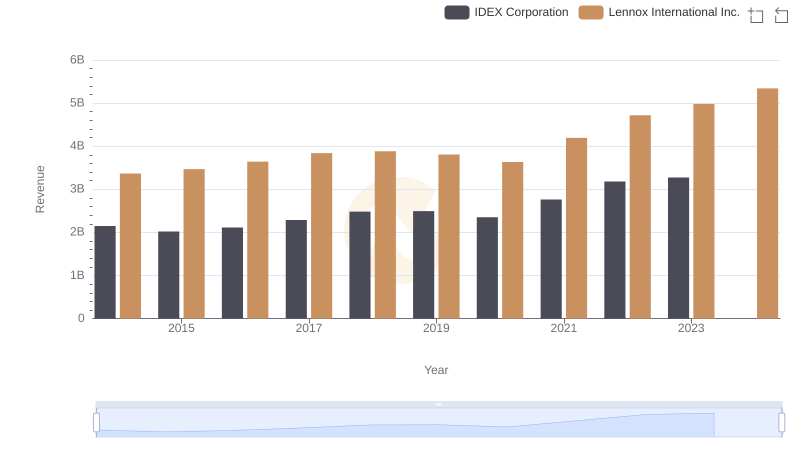
Who Generates More Revenue? Lennox International Inc. or IDEX Corporation
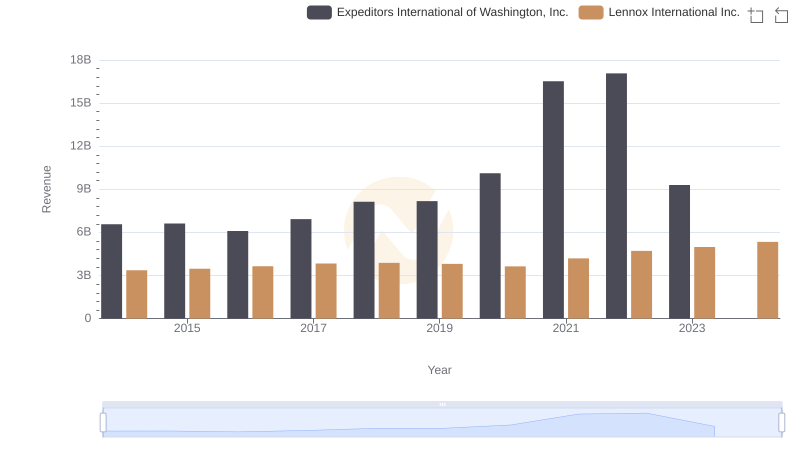
Lennox International Inc. vs Expeditors International of Washington, Inc.: Examining Key Revenue Metrics
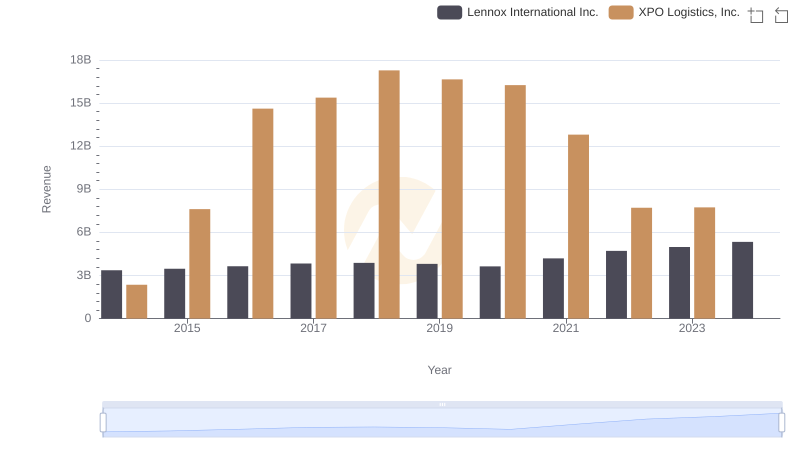
Revenue Showdown: Lennox International Inc. vs XPO Logistics, Inc.
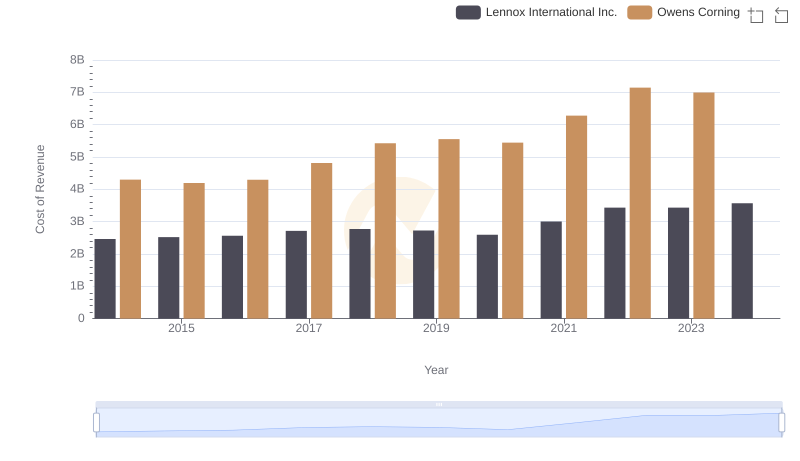
Cost Insights: Breaking Down Lennox International Inc. and Owens Corning's Expenses
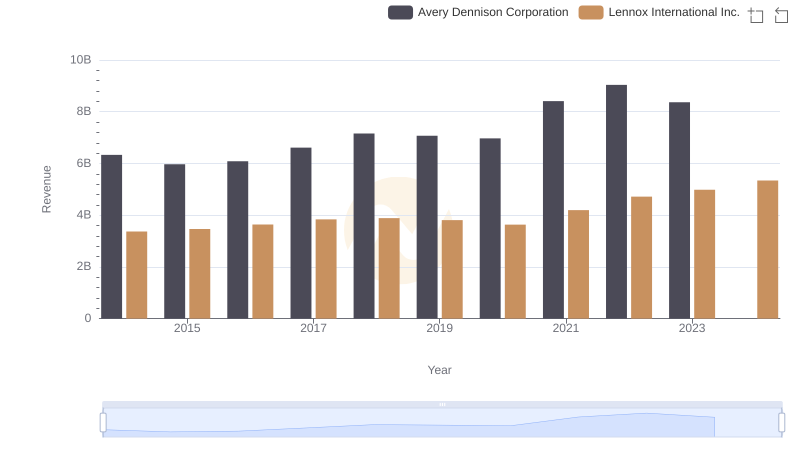
Lennox International Inc. and Avery Dennison Corporation: A Comprehensive Revenue Analysis
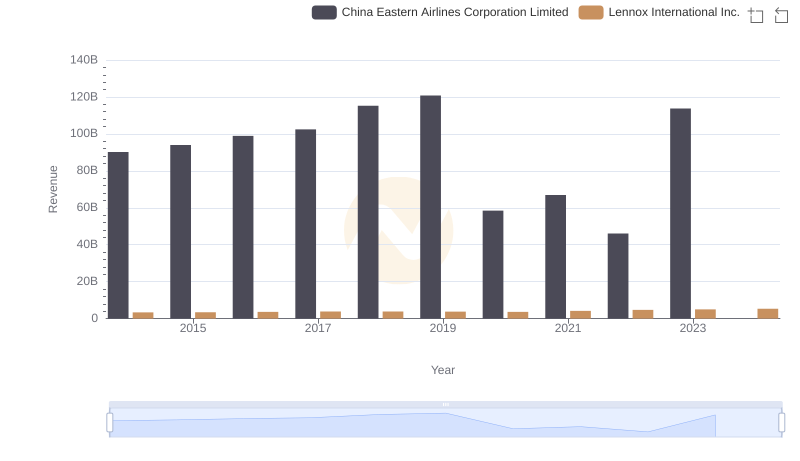
Revenue Insights: Lennox International Inc. and China Eastern Airlines Corporation Limited Performance Compared
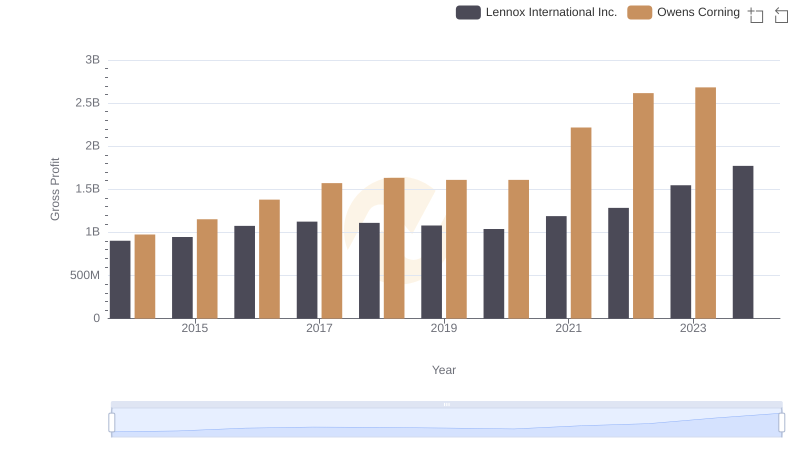
Gross Profit Analysis: Comparing Lennox International Inc. and Owens Corning
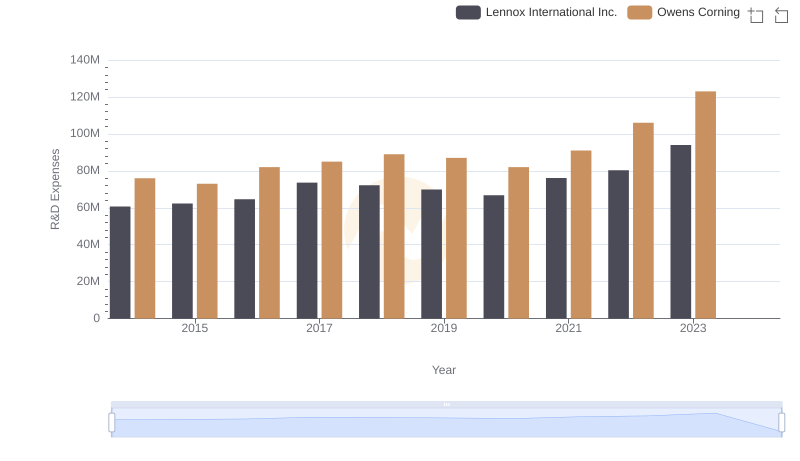
Research and Development: Comparing Key Metrics for Lennox International Inc. and Owens Corning
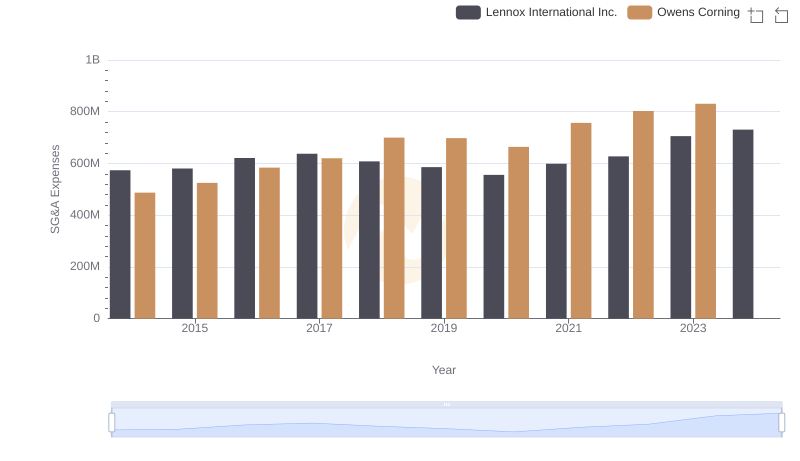
Lennox International Inc. or Owens Corning: Who Manages SG&A Costs Better?
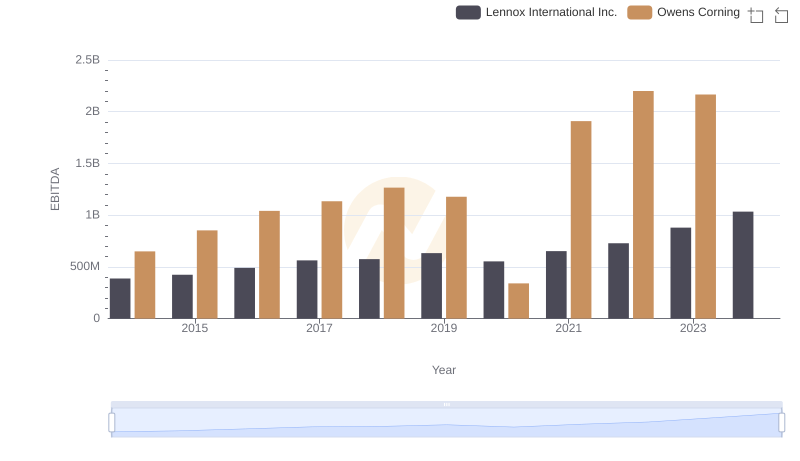
Comparative EBITDA Analysis: Lennox International Inc. vs Owens Corning